

Question: please help i have no idea how to do the graph pls hurry 1. Use the data table for Part A to prepare a plot
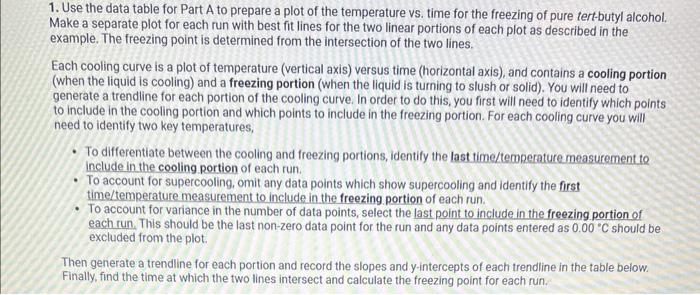
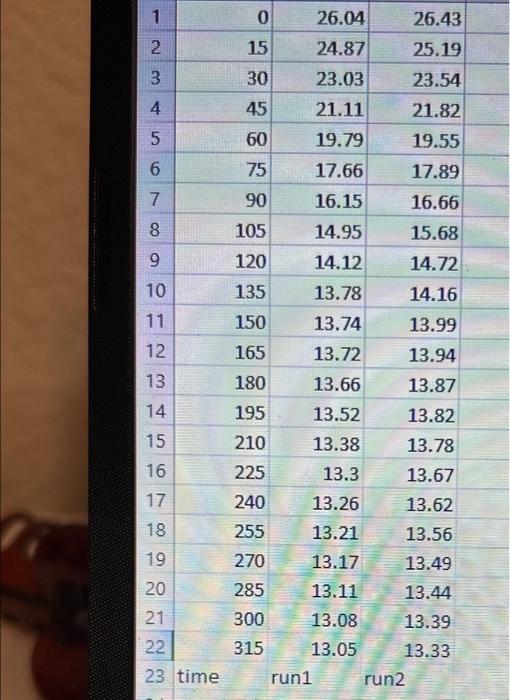
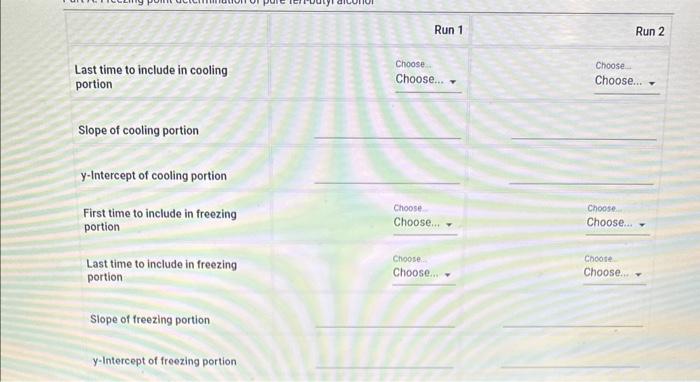
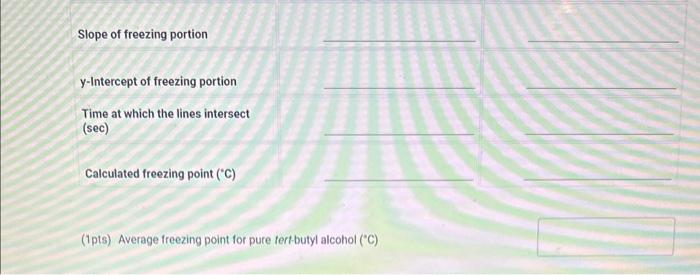
1. Use the data table for Part A to prepare a plot of the temperature vs. time for the freezing of pure tert-butyl alcohol. Make a separate plot for each run with best fit lines for the two linear portions of each plot as described in the example. The freezing point is determined from the intersection of the two lines. Each cooling curve is a plot of temperature (vertical axis) versus time (horizontal axis), and contains a cooling portion (when the liquid is cooling) and a freezing portion (when the liquid is turning to slush or solid). You will need to generate a trendline for each portion of the cooling curve. In order to do this, you first will need to identify which points to include in the cooling portion and which points to include in the freezing portion. For each cooling curve you will need to identify two key temperatures, - To differentiate between the cooling and freezing portions, identify the last time/temperature measurement to include in the cooling portion of each run. - To account for supercooling, omit any data points which show supercooling and identify the first time/temperature measurement to include in the freezing. portion of each run. - To account for variance in the number of data points, select the last point to include in the freezing portion of each run. This should be the last non-zero data point for the run and any data points entered as 0.00C should be excluded from the plot. Then generate a trendline for each portion and record the slopes and y-intercepts of each trendline in the table beiow. Finally, find the time at which the two lines intersect and calculate the freezing point for each run. \begin{tabular}{|c|r|r|r|} \hline 1 & 0 & 26.04 & 26.43 \\ \hline 2 & 15 & 24.87 & 25.19 \\ \hline 3 & 30 & 23.03 & 23.54 \\ \hline 4 & 45 & 21.11 & 21.82 \\ \hline 5 & 60 & 19.79 & 19.55 \\ \hline 6 & 75 & 17.66 & 17.89 \\ \hline 7 & 90 & 16.15 & 16.66 \\ \hline 8 & 105 & 14.95 & 15.68 \\ \hline 9 & 120 & 14.12 & 14.72 \\ \hline 10 & 135 & 13.78 & 14.16 \\ \hline 11 & 150 & 13.74 & 13.99 \\ \hline 12 & 165 & 13.72 & 13.94 \\ \hline 13 & 180 & 13.66 & 13.87 \\ \hline 14 & 195 & 13.52 & 13.82 \\ \hline 15 & 210 & 13.38 & 13.78 \\ \hline 16 & 225 & 13.3 & 13.67 \\ \hline 17 & 240 & 13.26 & 13.62 \\ \hline 18 & 255 & 13.21 & 13.56 \\ \hline 19 & 270 & 13.17 & 13.49 \\ \hline 20 & 285 & 13.11 & 13.44 \\ \hline 21 & 300 & 13.08 & 13.39 \\ \hline 22 & 315 & 13.05 & 13.33 \\ \hline \end{tabular} 23 time run 1 run2 Last time to include in cooling portion Run 1 Run 2 Slope of cooling portion y-Intercept of cooling portion First time to include in freezing portion Choose Choose Choose... Choose... (.) Last time to include in freezing portion. Slope of freezing portion y-Intercept of freezing portion (1pts) Average treezing point tor pure tertbutyl aiconol ("C) 1. Use the data table for Part A to prepare a plot of the temperature vs. time for the freezing of pure tert-butyl alcohol. Make a separate plot for each run with best fit lines for the two linear portions of each plot as described in the example. The freezing point is determined from the intersection of the two lines. Each cooling curve is a plot of temperature (vertical axis) versus time (horizontal axis), and contains a cooling portion (when the liquid is cooling) and a freezing portion (when the liquid is turning to slush or solid). You will need to generate a trendline for each portion of the cooling curve. In order to do this, you first will need to identify which points to include in the cooling portion and which points to include in the freezing portion. For each cooling curve you will need to identify two key temperatures, - To differentiate between the cooling and freezing portions, identify the last time/temperature measurement to include in the cooling portion of each run. - To account for supercooling, omit any data points which show supercooling and identify the first time/temperature measurement to include in the freezing. portion of each run. - To account for variance in the number of data points, select the last point to include in the freezing portion of each run. This should be the last non-zero data point for the run and any data points entered as 0.00C should be excluded from the plot. Then generate a trendline for each portion and record the slopes and y-intercepts of each trendline in the table beiow. Finally, find the time at which the two lines intersect and calculate the freezing point for each run. \begin{tabular}{|c|r|r|r|} \hline 1 & 0 & 26.04 & 26.43 \\ \hline 2 & 15 & 24.87 & 25.19 \\ \hline 3 & 30 & 23.03 & 23.54 \\ \hline 4 & 45 & 21.11 & 21.82 \\ \hline 5 & 60 & 19.79 & 19.55 \\ \hline 6 & 75 & 17.66 & 17.89 \\ \hline 7 & 90 & 16.15 & 16.66 \\ \hline 8 & 105 & 14.95 & 15.68 \\ \hline 9 & 120 & 14.12 & 14.72 \\ \hline 10 & 135 & 13.78 & 14.16 \\ \hline 11 & 150 & 13.74 & 13.99 \\ \hline 12 & 165 & 13.72 & 13.94 \\ \hline 13 & 180 & 13.66 & 13.87 \\ \hline 14 & 195 & 13.52 & 13.82 \\ \hline 15 & 210 & 13.38 & 13.78 \\ \hline 16 & 225 & 13.3 & 13.67 \\ \hline 17 & 240 & 13.26 & 13.62 \\ \hline 18 & 255 & 13.21 & 13.56 \\ \hline 19 & 270 & 13.17 & 13.49 \\ \hline 20 & 285 & 13.11 & 13.44 \\ \hline 21 & 300 & 13.08 & 13.39 \\ \hline 22 & 315 & 13.05 & 13.33 \\ \hline \end{tabular} 23 time run 1 run2 Last time to include in cooling portion Run 1 Run 2 Slope of cooling portion y-Intercept of cooling portion First time to include in freezing portion Choose Choose Choose... Choose... (.) Last time to include in freezing portion. Slope of freezing portion y-Intercept of freezing portion (1pts) Average treezing point tor pure tertbutyl aiconol ("C)
Step by Step Solution
There are 3 Steps involved in it

Get step-by-step solutions from verified subject matter experts