

Question: Please help me answer the question below fLine Graph A Line Graph B US Civilian Labor Force (2007-2016) US Civilian Labor Force (2007-2016) 162000 y
Please help me answer the question below
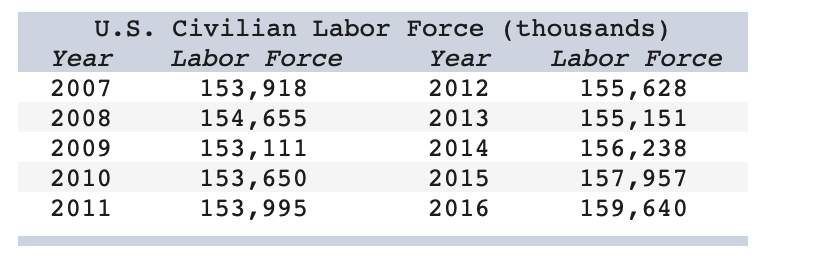
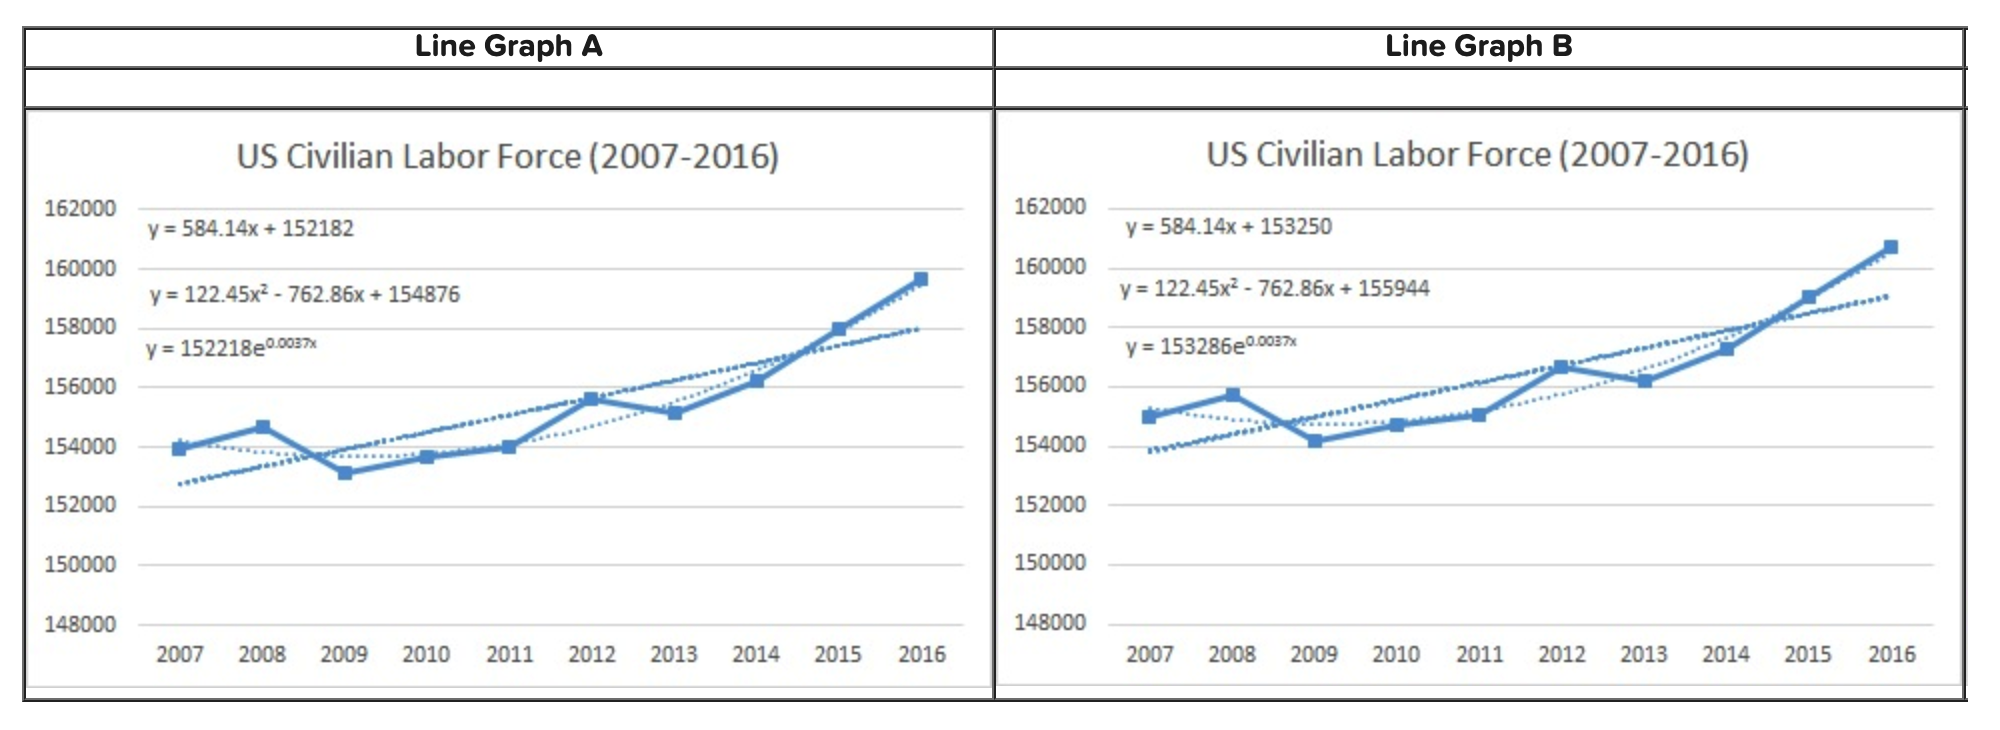
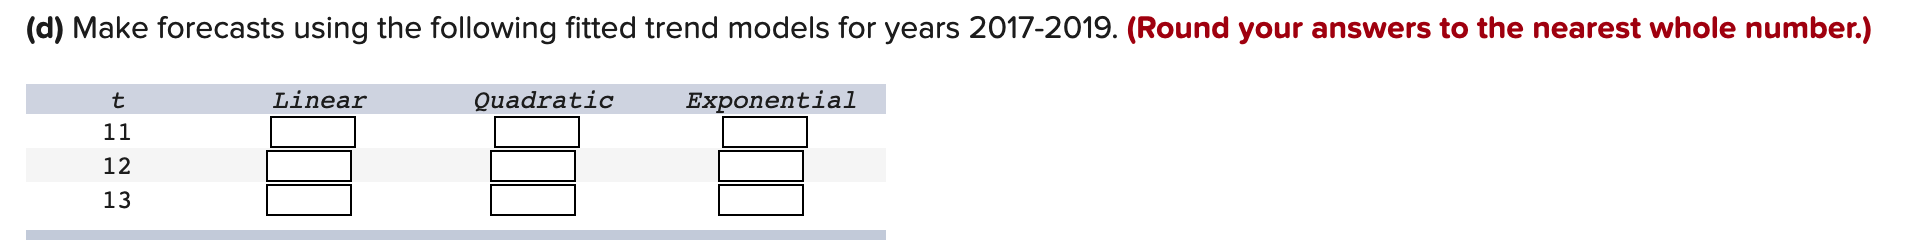
\fLine Graph A Line Graph B US Civilian Labor Force (2007-2016) US Civilian Labor Force (2007-2016) 162000 y = 584.14x + 152182 162000 y = 584.14x + 153250 160000 160000 y = 122.45x2 - 762.86x + 154876 y = 122.45x2 - 762.86x + 155944 158000 y = 152218-0.0037x 158000 y = 153286e0.0037x 156000 156000 154000 154000 152000 152000 150000 150000 148000 148000 2007 2008 2009 2010 2011 2012 2013 2014 2015 2016 2007 2008 2009 2010 2011 2012 2013 2014 2015 2016(d) Make forecasts using the following fitted trend models for years 2017-2019. (Round your answers to the nearest whole number.) t Linear Quadratic Exponential 11 12 13
Step by Step Solution
There are 3 Steps involved in it

Get step-by-step solutions from verified subject matter experts