

Question: Please help me Question 1 1 pts 40 20 -2 -1 0 2 3 4 5 6 -20 -40 -60 The graph of y =
Please help me
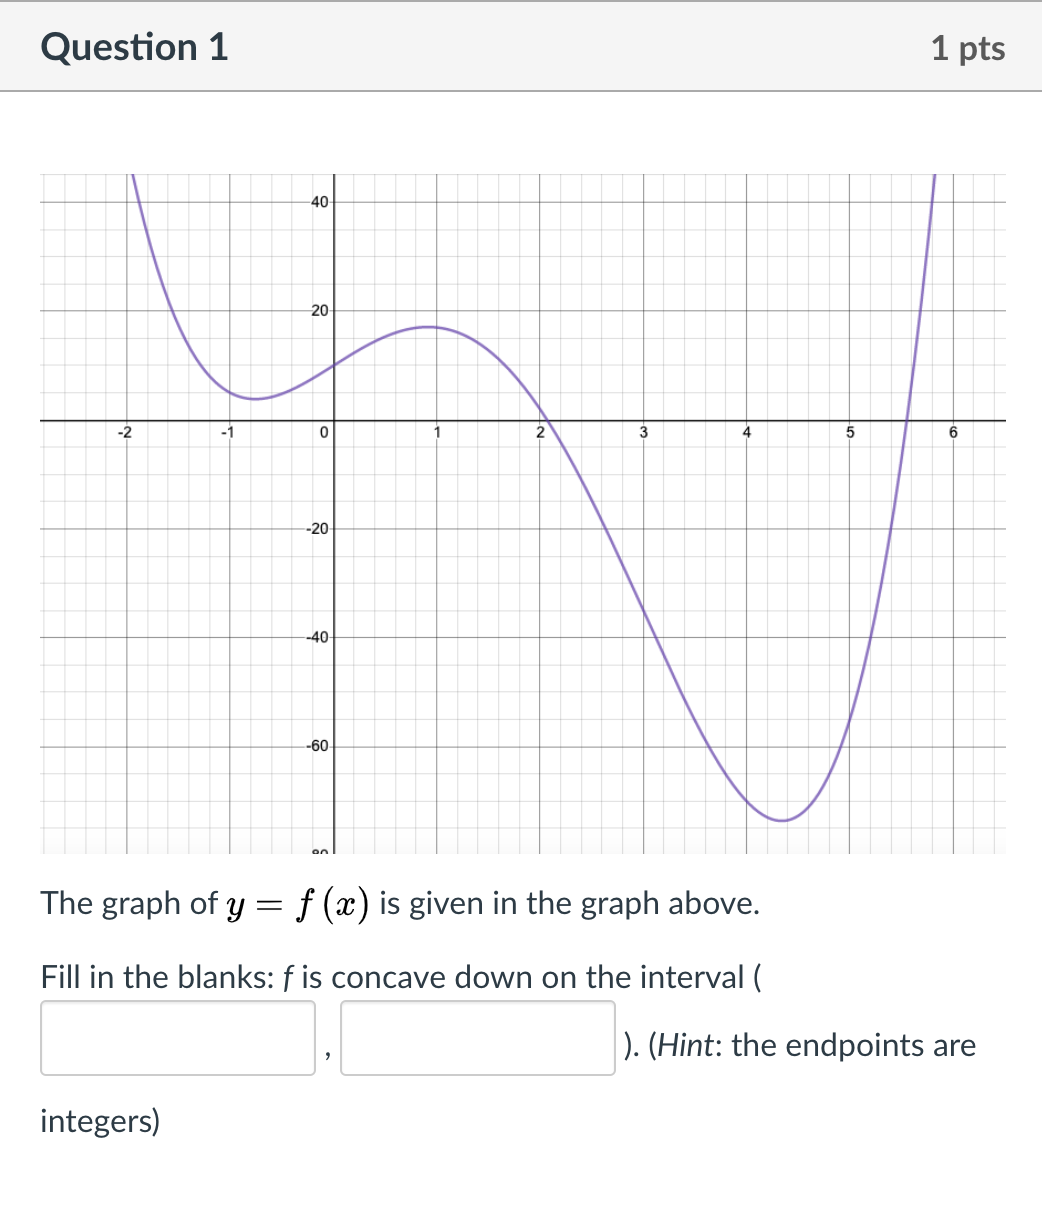
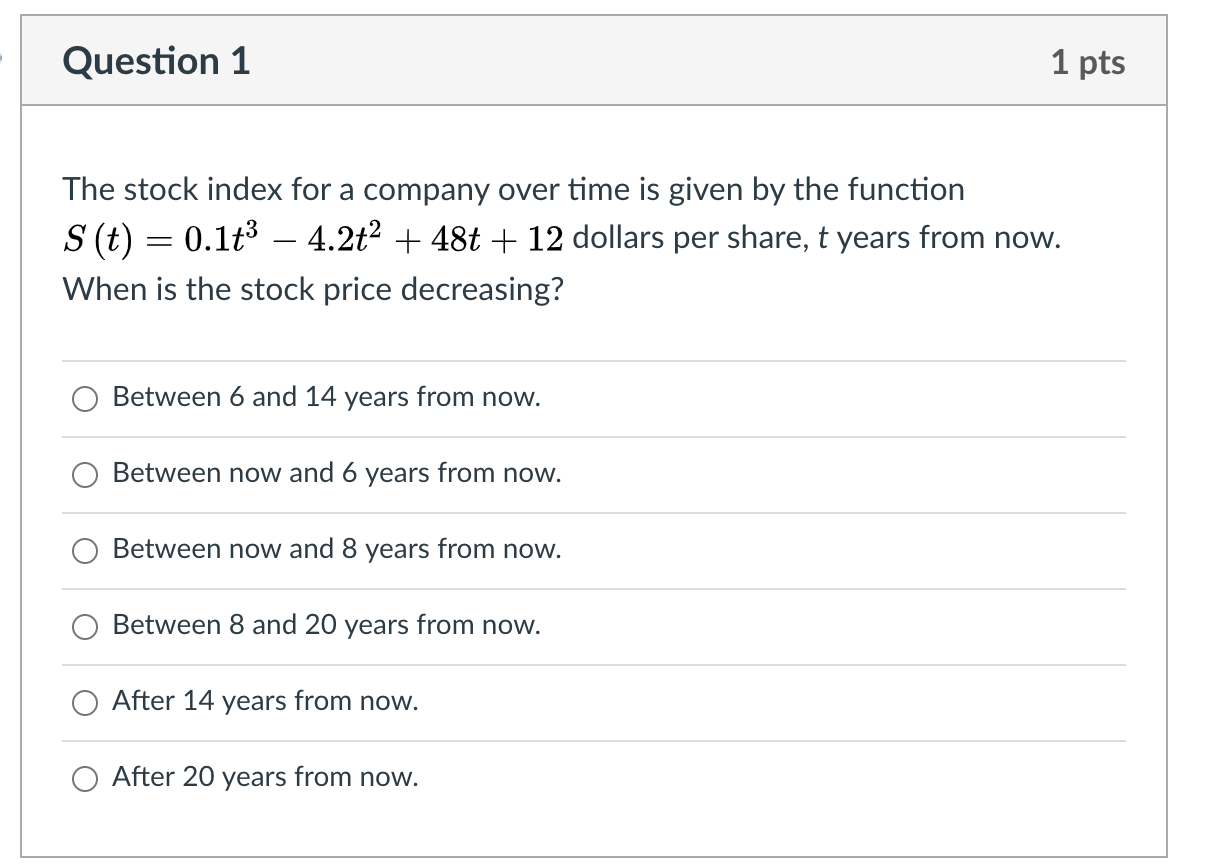
Question 1 1 pts 40 20 -2 -1 0 2 3 4 5 6 -20 -40 -60 The graph of y = f (a) is given in the graph above. Fill in the blanks: f is concave down on the interval ( ). (Hint: the endpoints are integers)' Question 1 1 pts The stock index for a company over time is given by the function 3 (t) = 0.1t3 4,2152 | 48t | 12 dollars per share, tyears from now. When is the stock price decreasing? 0 Between 6 and 14 years from now. 0 Between now and 6 years from now. 0 Between now and 8 years from now. 0 Between 8 and 20 years from now. 0 After 14 years from now. 0 After 20 years from now
Step by Step Solution
There are 3 Steps involved in it
1 Expert Approved Answer
Step: 1 Unlock

Question Has Been Solved by an Expert!
Get step-by-step solutions from verified subject matter experts
Step: 2 Unlock
Step: 3 Unlock