

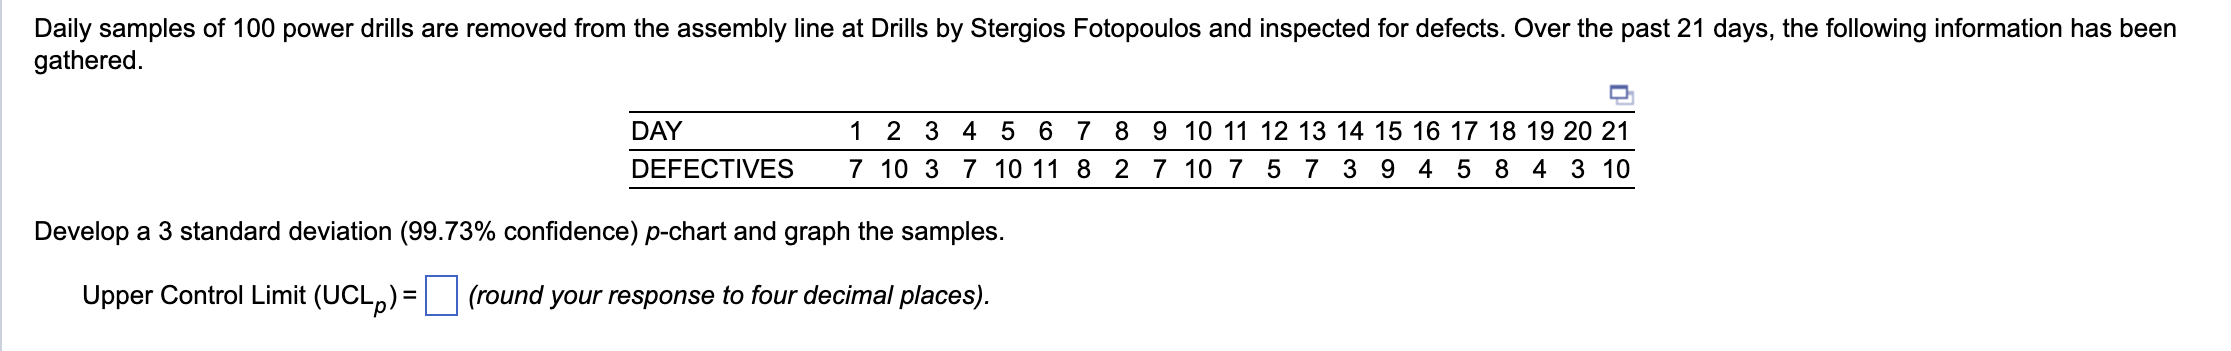
Question: Please help me solve this with all requirements provided in the pictures Develop a 3 standard deviation ( 99.73% confidence) p-chart and graph the samples.
 Please help me solve this with all requirements provided in the pictures
Step by Step Solution
There are 3 Steps involved in it
1 Expert Approved Answer
Step: 1 Unlock

Question Has Been Solved by an Expert!
Get step-by-step solutions from verified subject matter experts
Step: 2 Unlock
Step: 3 Unlock