

Question: Please help me with step-by-step calculations using Excel VALUE DRIVERS Sales Growth yrs 2-3 Sales Growth yr 4 Expenses as % of sales Cost of
Please help me with step-by-step calculations using Excel
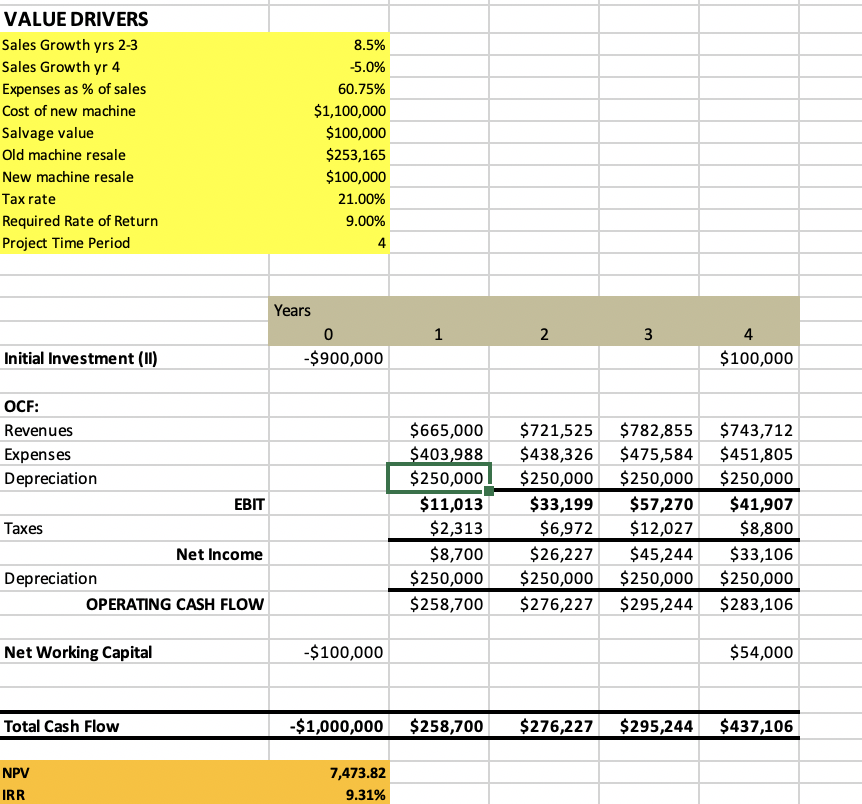
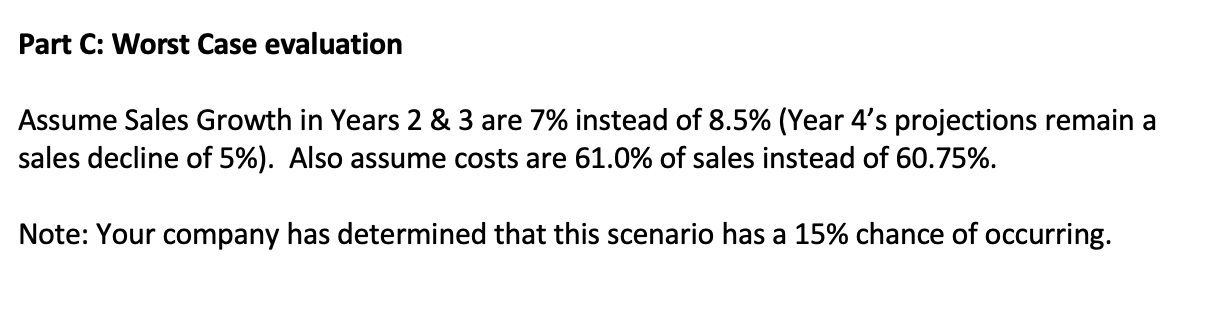
VALUE DRIVERS Sales Growth yrs 2-3 Sales Growth yr 4 Expenses as % of sales Cost of new machine Salvage value Old machine resale New machine resale Tax rate Required Rate of Return Project Time Period 8.5% -5.0% 60.75% $1,100,000 $100,000 $253,165 $100,000 21.00% 9.00% Years Initial Investment (1) -$900,000 $100,000 OCF: Revenues Expenses Depreciation EBIT Taxes Net Income Depreciation OPERATING CASH FLOW $665,000 $403,988 $250,000 $11,0137 $2,313 $8,700 $250,000 $258,700 $721,525 $438,326 $250,000 $33,199 $6,972 $26,227 $250,000 $276,227 $782,855 $475,584 $250,000 $57,270 $12,027 $45,244 $250,000 $295,244 $743,712 $451,805 $250,000 $41,907 $8,800 $33,106 $250,000 $283,106 Net Working Capital -$100,000 $54,000 Total Cash Flow -$1,000,000 $258,700 $276,227 $295,244 $437,106 NPV 7,473.82 9.31% IRR Part C: Worst Case evaluation Assume Sales Growth in Years 2 & 3 are 7% instead of 8.5% (Year 4's projections remain a sales decline of 5%). Also assume costs are 61.0% of sales instead of 60.75%. Note: Your company has determined that this scenario has a 15% chance of occurring. VALUE DRIVERS Sales Growth yrs 2-3 Sales Growth yr 4 Expenses as % of sales Cost of new machine Salvage value Old machine resale New machine resale Tax rate Required Rate of Return Project Time Period 8.5% -5.0% 60.75% $1,100,000 $100,000 $253,165 $100,000 21.00% 9.00% Years Initial Investment (1) -$900,000 $100,000 OCF: Revenues Expenses Depreciation EBIT Taxes Net Income Depreciation OPERATING CASH FLOW $665,000 $403,988 $250,000 $11,0137 $2,313 $8,700 $250,000 $258,700 $721,525 $438,326 $250,000 $33,199 $6,972 $26,227 $250,000 $276,227 $782,855 $475,584 $250,000 $57,270 $12,027 $45,244 $250,000 $295,244 $743,712 $451,805 $250,000 $41,907 $8,800 $33,106 $250,000 $283,106 Net Working Capital -$100,000 $54,000 Total Cash Flow -$1,000,000 $258,700 $276,227 $295,244 $437,106 NPV 7,473.82 9.31% IRR Part C: Worst Case evaluation Assume Sales Growth in Years 2 & 3 are 7% instead of 8.5% (Year 4's projections remain a sales decline of 5%). Also assume costs are 61.0% of sales instead of 60.75%. Note: Your company has determined that this scenario has a 15% chance of occurring
Step by Step Solution
There are 3 Steps involved in it

Get step-by-step solutions from verified subject matter experts