

Question: Please help this problem. Thank you very much! 22. Problem 22 Suppose there is some hypothetical economy in which households spend $0.50 of each additional
Please help this problem. Thank you very much!
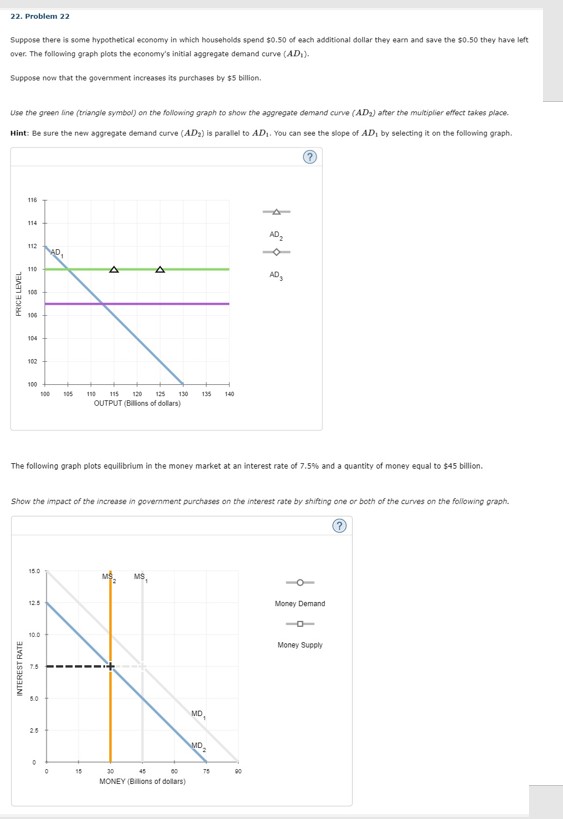
22. Problem 22 Suppose there is some hypothetical economy in which households spend $0.50 of each additional dollar they earn and save the $0.50 they have left over. The following graph plots the economy's initial aggregate demand curve (AP, ). Suppose now that the government increases its purchases by $5 billion, Use the green line (triangle symbol) on the following graph to show the aggregate demand curve ( AD.) after the multiplier effect takes place. Hint: Be sure the new aggregate demand curve (AD),) is parallel to AD) . You can see the slope of A.D, by selecting it on the following graph. 116 114 AD2 14 A ADS PRICE LEVEL 108 10 ID- 100 114 120 124 130 135 OUTPUT (Billions of dollars) The following graph plots equilibrium in the money market at an interest rate of 7.5% and a quantity of money equal to $45 billion. Show the impact of the increase in government purchases on the interest rate by shifting one or both of the curves on the following graph. MS. MS, Money Demand O 10.0 Money Supply INTEREST RATE MD. 15 45 MONEY (Billions of dollars)
Step by Step Solution
There are 3 Steps involved in it

Get step-by-step solutions from verified subject matter experts