

Question: Please help with all codes! used to model the default risk of a company or country (more specifically, the default of a company's or country's
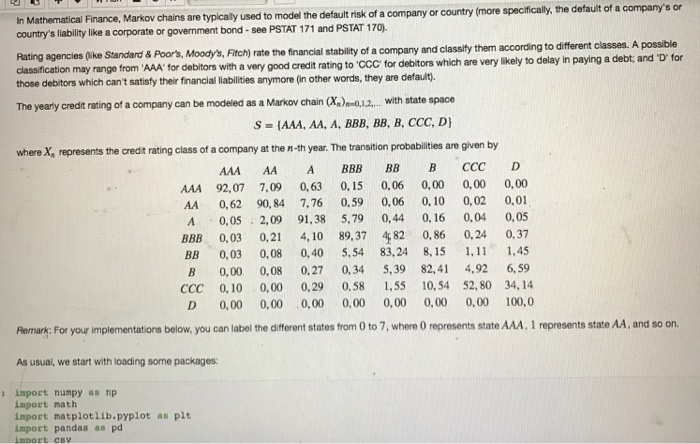

used to model the default risk of a company or country (more specifically, the default of a company's or country's liablity like a corporate or government bond -see PSTAT 171 and PSTAT 170). classity them according to different classes. A possible debt and D for Rating agencies (like Standard & Poor's, Moody's, Fitch) rate the financial stability of a company and classification may range from 'AAA' for deblitors with a very good credit rating to CcC for debitors which are very likely to delay in paying a those debitors which can't satisty their financial liabilities anymore (in other words, they are defaut). with state space The yearly credit rating of a company can be modeled as a Markov chain)0.1.2. where x, represents the credt rating class of a company at the n-th year. The transition probabilities are given by AAA AA A BBB BB B AAA 92,07 7,09 0,63 0.15 0,06 0,00 0,00 0,00 AA 0,62 90,84 7.76 0.59 0.06 0,10 0,02 0,01 A 0,052,09 91,38 ,79 0,44 0,16 0,04 0,05 BBB 0,03 0,21 4,10 89,37 482 0,86 0,24 0,37 BB 0,03 0,08 0,40 5,54 83,24 8,15 1,1 1,45 B 0,00 0,08 0.27 0,34 5,39 82,41 4,92 6,59 CCC 0,10 0,00 0,29 0,58 55 10,54 52,80 34, 14 D 0,00 0,00 0,00 0.00 0,00 0,00 0,00 100,0 Remark: For your implementations below, you can label the different states trom 0 to 7, where 0 represents state AAA. 1 represents state AA, and so on. As usual, we start with loading some packages: s inport numpy as np aport math import matplotlib.pyplot as pit import pandas as pd used to model the default risk of a company or country (more specifically, the default of a company's or country's liablity like a corporate or government bond -see PSTAT 171 and PSTAT 170). classity them according to different classes. A possible debt and D for Rating agencies (like Standard & Poor's, Moody's, Fitch) rate the financial stability of a company and classification may range from 'AAA' for deblitors with a very good credit rating to CcC for debitors which are very likely to delay in paying a those debitors which can't satisty their financial liabilities anymore (in other words, they are defaut). with state space The yearly credit rating of a company can be modeled as a Markov chain)0.1.2. where x, represents the credt rating class of a company at the n-th year. The transition probabilities are given by AAA AA A BBB BB B AAA 92,07 7,09 0,63 0.15 0,06 0,00 0,00 0,00 AA 0,62 90,84 7.76 0.59 0.06 0,10 0,02 0,01 A 0,052,09 91,38 ,79 0,44 0,16 0,04 0,05 BBB 0,03 0,21 4,10 89,37 482 0,86 0,24 0,37 BB 0,03 0,08 0,40 5,54 83,24 8,15 1,1 1,45 B 0,00 0,08 0.27 0,34 5,39 82,41 4,92 6,59 CCC 0,10 0,00 0,29 0,58 55 10,54 52,80 34, 14 D 0,00 0,00 0,00 0.00 0,00 0,00 0,00 100,0 Remark: For your implementations below, you can label the different states trom 0 to 7, where 0 represents state AAA. 1 represents state AA, and so on. As usual, we start with loading some packages: s inport numpy as np aport math import matplotlib.pyplot as pit import pandas as pd
Step by Step Solution
There are 3 Steps involved in it

Get step-by-step solutions from verified subject matter experts