

Question: please i want a matlab code to show the iteration of false position method and i dont want a graph.. the values of the starting
please i want a matlab code to show the iteration of false position method and i dont want a graph.. the values of the starting is (X lower)=0.5 and (X upper)=1 and (Es)=0.02 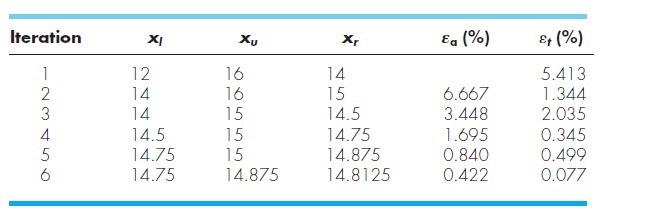
(i want the output on the screen like the table ) 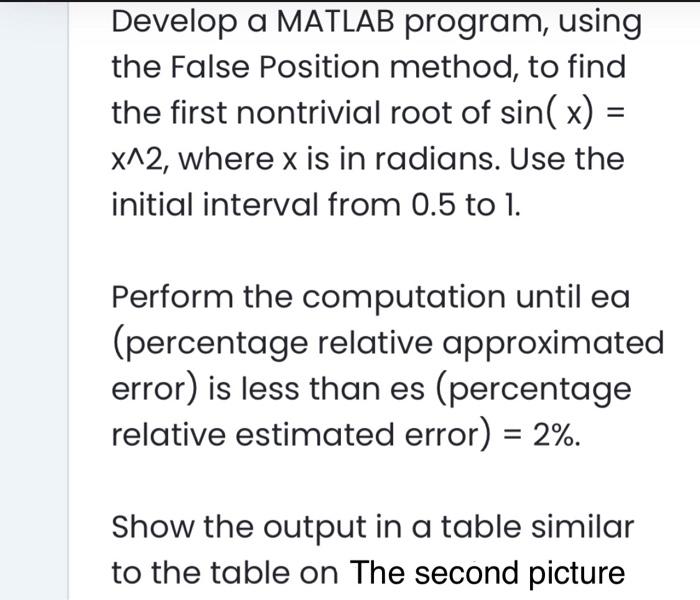
Develop a MATLAB program, using the False Position method, to find the first nontrivial root of sin( x) = x^2, where x is in radians. Use the initial interval from 0.5 to 1. Perform the computation until ea (percentage relative approximated error) is less than es (percentage relative estimated error) = 2%. Show the output in a table similar to the table on The second picture Iteration X X, Ea (%) & (%) 1 2 3 NO 12 14 14 14.5 14.75 14.75 16 16 15 15 15 14.875 14 15 14.5 14.75 14.875 14.8125 6.667 3.448 1.695 0.840 0.422 5.413 1.344 2.035 0.345 0.499 0.077 5 6
Step by Step Solution
There are 3 Steps involved in it
1 Expert Approved Answer
Step: 1 Unlock

Question Has Been Solved by an Expert!
Get step-by-step solutions from verified subject matter experts
Step: 2 Unlock
Step: 3 Unlock