

Question: please make sure to graph the answers. Each object you can manipulate or place on the graph has its own unique features as well as
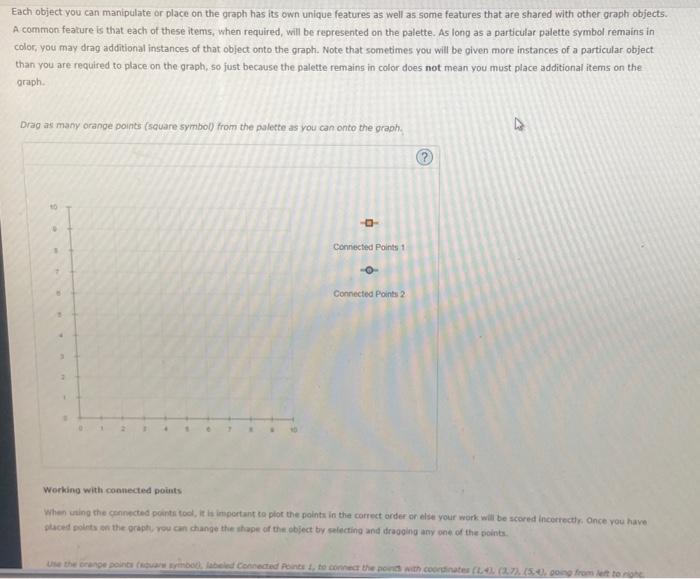
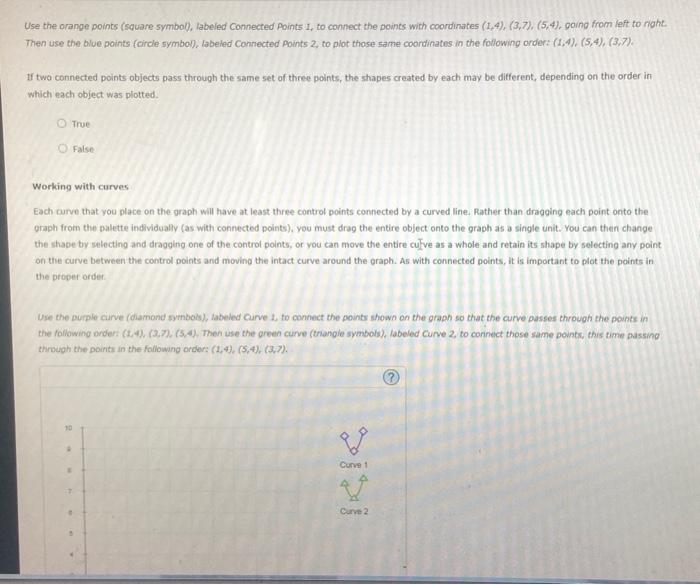
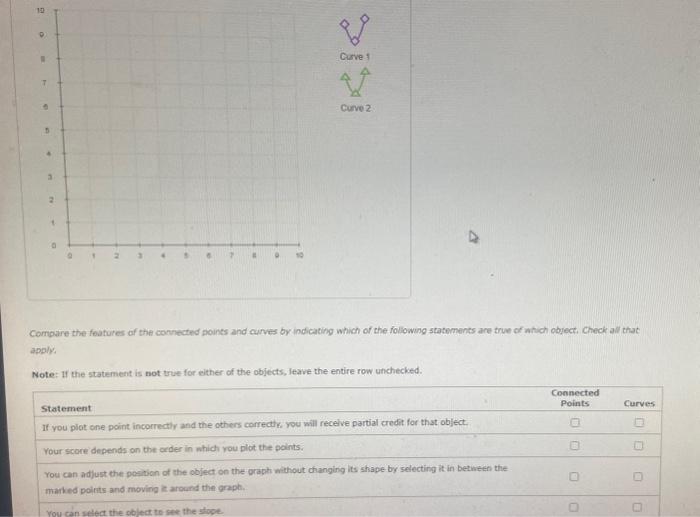
Each object you can manipulate or place on the graph has its own unique features as well as some features that are shared with other graph objects. A common feature is that each of these items, when required, will be represented on the palette. As long as a particular palette symbol remains in color, you may drag additional instances of that object onto the graph. Note that sometimes you will be given more instances of a particular object. than you are required to place on the graph, so just because the palette remains in color does not mean you must piace additional items on the graph. Drag as many orange points (square symbol) from the palette as you can onto the graph. Workino with connected points When sting the connected points tool, it la inportant to plot the points in the correct order on else your work will be scered inceriectly. Once vou have. ptaced points on the prepty, rou can change the shage of the object by selecting and draoging any one of the points. Use the orange points (square symbol), labeled Connected Aoints 1 , to connect the points with coordinates (1,4),(3,7),(5,4), going from left to night. Then use the blue points (circle symbol), labeled Connected Points 2 , to plot those same coordinates in the following order: (1,4)),(5,4),(3,7). If two connected points objects pass through the same set of three points, the shapes created by each may be different, depending on the order in which each object was plotted. True False Working with curves Each curve that you place on the graph will have at least three control points connected by a curved line. Rather than dragging each point onto the eraph from the palette individually (as with connected points), you must drag the entire object onto the graph as a single unit. You can then change the shape by selecting and dragging one of the control points, or vou can move the entire culve as a whole and retain its shape by selecting any point on the curve between the control points and moving the intact curve around the graph. As with connected points, it is important to plot the points in the proper order. Use the purple curve (diamond symbols), labeled Curve 2 , to connect the points shown on the graph so that the curve passes through the points in the following onder: (2,4),(2,7),(5,4), Then use the green curve (thangle symbols), labeled Curve 2 , to coninect those same points, this time passing through the points in the following order: (1,4),(5,4),(3,7). Compare the features of the confected points and curves by indicating which of the tollowing staterments are true of ahich object, Check all that applys Note: If the statement is not true for either of the objects, leave the entire row unchecked
Step by Step Solution
There are 3 Steps involved in it

Get step-by-step solutions from verified subject matter experts