

Question: Please only use excel formulas and show them so I can understand. For part d, estimate Goodman's and Landry's betas as the slopes of regression
 Please only use excel formulas and show them so I can understand. For part d, estimate Goodman's and Landry's betas as the slopes of regression lines. Stock returns on the y-axis and market returns on the x-axis. For part e, calculate the expected return on the market, then use the SML equation to calculate Goodman's and Landry's required return.
Data for Goodman and Landry:
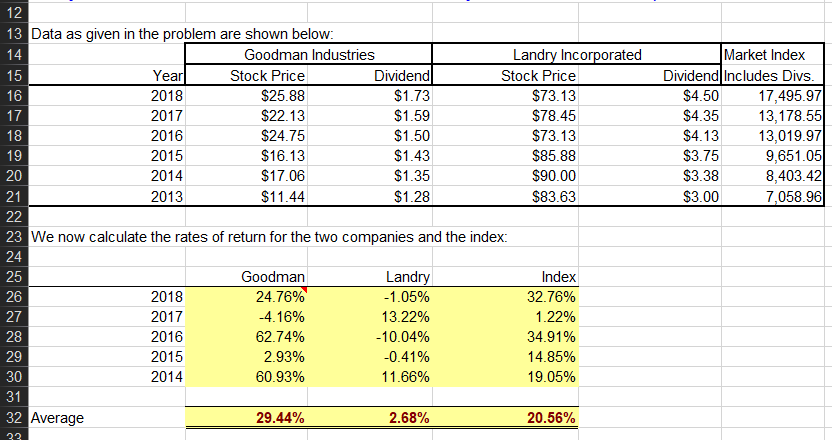
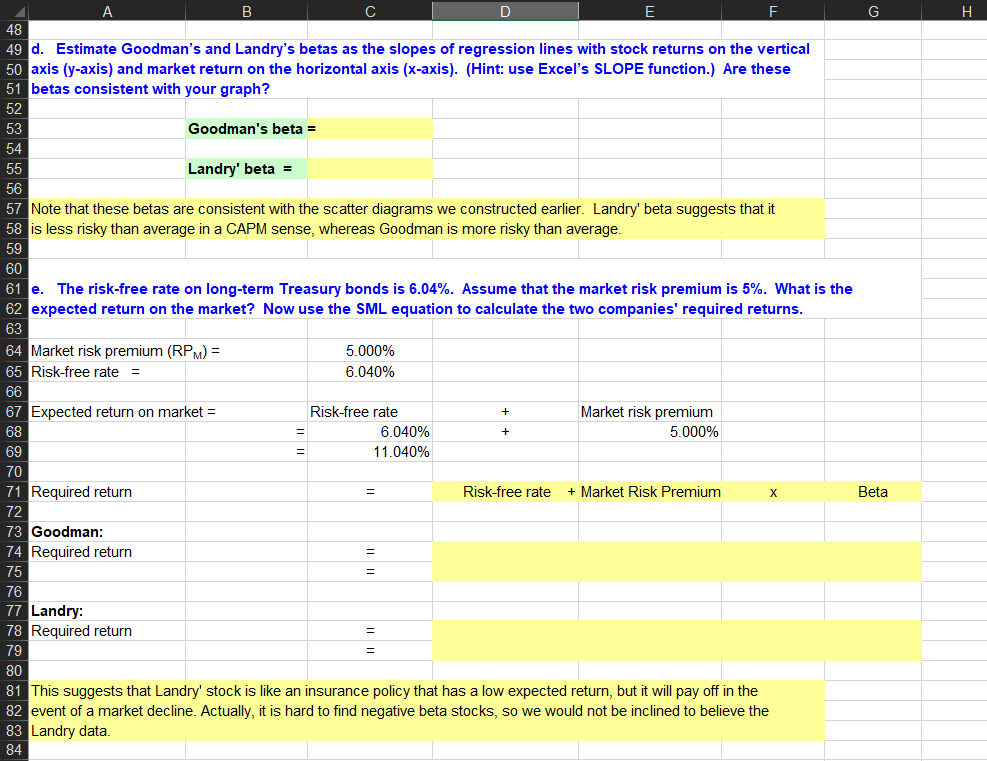
49 d. Estimate Goodman's and Landry's betas as the slopes of regression lines with stock returns on the vertical 0 axis (y-axis) and market return on the horizontal axis (x-axis). (Hint: use Excel's SLOPE function.) Are these betas consistent with your graph? Goodman's beta- Landry' beta- 57 Note that these betas are consistent with the scatter diagrams we constructed earlier. Landry' beta suggests that it 58 is less risky than average in a CAPM sense, whereas Goodman is more risky than average 59 60 e. The risk-free rate on long-term Treasury bonds is 6.04%. Assume that the market risk premium is 5%. What is the expected return on the market? Now use the SML equation to calculate the two companies' required returns 62 Market risk premium (RPM)- Risk-free rate 5.000% 6.040% 67 Expected return on market- Risk-free rate Market risk premium 5.000% 6.040% 11 .040% 69 70 Required return Risk-free rate +Market Risk Premium Beta 72 Goodman Required return 75 76 Landry: Required return 79 80 This suggests that Landry' stock is like an insurance policy that has a low expected return, but it will pay off in the event of a market decline. Actually, it is hard to find negative beta stocks, so we would not be inclined to believe the Landry data 83 84 13 Data as given in the problem are shown below 15 17 Goodman Industries Landry Inco rated Market Index Dividend Includes Divs Year 2018 2017 2016 2015 2014 2013 Stock Price $25.88 $22.13 $24.75 $16.13 $17.06 Dividend $1.73 $1.59 $1.50 $1.43 $1.35 Stock Price $73.13 $78.45 $73.13 $85.88 $90.00 $4.50 $4.35 $4.13 $3.75 $3.38 S3.00 17,495.97 13,178.55 13,019.97 9,651.05 8,403.42 7,058.96 18 20 21 23 24 25 26 27 28 29 30 We now calculate the rates of return for the two companies and the index: 2018 2017 2016 2015 2014 Goodman 24.76% -4.16% 62.74% 2.93% 60.93% Land -1.05% 13.22% -10.04% -0.41% 1 1.66% Index 3276% 1.22% 34.91% 14.85% 19.05% 32 Average 29.44% 2.68% 20.56%
Step by Step Solution
There are 3 Steps involved in it

Get step-by-step solutions from verified subject matter experts