

Question: >>>>PLEASE READ THIS IMPORTANT NOTE BEFORE TRYING TO ANSWER THIS QUESTION: You'll have to zoom in with your web browser in order to see the
>>>>PLEASE READ THIS IMPORTANT NOTE BEFORE TRYING TO ANSWER THIS QUESTION: You'll have to zoom in with your web browser in order to see the chart. I've tried uploading it again in another question posting but no matter how much I change the picture dimensions, it doesn't actually change when I update it.
I strongly recommend Google Chrome. You can find the 'zoom in' feature on the upper right-hand corner, where the three vertical dots are.
Thanks!
--------------------------------------------------------------------------------------------------------------------------------------------------------------------------------------------------------------------------
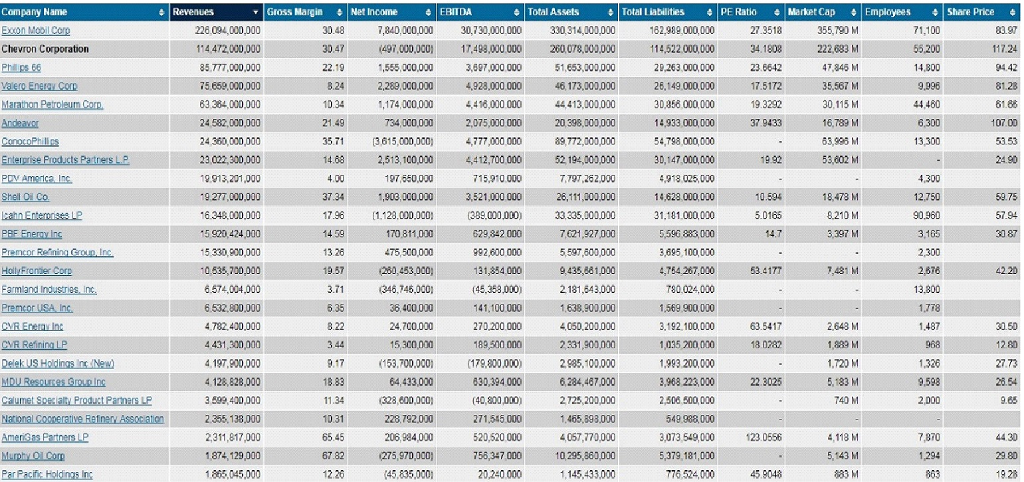
CHEVRON is my selected company. Use the chart above to answer questions below:
* How is your selected company performing against its competition? (Don't just say better or worse on particular ratios - try to think of and offer reasons why).
Company Name | EBITDA | Total Assets | Total liabilities | PF Ratio Market Cap Employees | Sharie price Chevron Corporation 14 42000,000 17,498,000,000 260,078000,000 26,149.000,000 30,858 000,000 14,933,000,000 75.659,000,000 17.5172 46 173,000,000 4413,000,000 20 398,000,000 89,772,000,000 9.3292 115 M 734,000,000 24 582,000,000 24 360,000,000 23 022,300,000 19913,201,000 3571 3615,000,000) 4,777,000.000 53,602 M ,918 025,000 6.348,000,000 17.96 1.128,000.000! 33.335,000000 5.330,900,000 10.535,700,000 6.574004,000 9435,881000 2 181,643.000 Holl Fromer Core 31,854000 4,754 267,000 53.41771,481 hM (346,746,000 780.024,000 1.569.900,000 3192.100000 63.5417 4.782,400.000 431,300,000 4,197,900,000 4.128,828,000 3 899,400,000 2355,138,000 24,700,000 270.200.000 4050.200,000 2,331,900000 2985,100.000 6,284,487000 2,643 M (153,700,000 (179.800,000) 830,394 000 .993.200.00 3,968 223,000 1,720 M 4,433,000 228,792.000 275,970,000 549 988000 1.465,893.000 770,000 520,520 000 4,118 M 1005045.000 (45,635.000 20,240.000 1,145,433,000 776.524,00 45.9048 Company Name | EBITDA | Total Assets | Total liabilities | PF Ratio Market Cap Employees | Sharie price Chevron Corporation 14 42000,000 17,498,000,000 260,078000,000 26,149.000,000 30,858 000,000 14,933,000,000 75.659,000,000 17.5172 46 173,000,000 4413,000,000 20 398,000,000 89,772,000,000 9.3292 115 M 734,000,000 24 582,000,000 24 360,000,000 23 022,300,000 19913,201,000 3571 3615,000,000) 4,777,000.000 53,602 M ,918 025,000 6.348,000,000 17.96 1.128,000.000! 33.335,000000 5.330,900,000 10.535,700,000 6.574004,000 9435,881000 2 181,643.000 Holl Fromer Core 31,854000 4,754 267,000 53.41771,481 hM (346,746,000 780.024,000 1.569.900,000 3192.100000 63.5417 4.782,400.000 431,300,000 4,197,900,000 4.128,828,000 3 899,400,000 2355,138,000 24,700,000 270.200.000 4050.200,000 2,331,900000 2985,100.000 6,284,487000 2,643 M (153,700,000 (179.800,000) 830,394 000 .993.200.00 3,968 223,000 1,720 M 4,433,000 228,792.000 275,970,000 549 988000 1.465,893.000 770,000 520,520 000 4,118 M 1005045.000 (45,635.000 20,240.000 1,145,433,000 776.524,00 45.9048
Step by Step Solution
There are 3 Steps involved in it

Get step-by-step solutions from verified subject matter experts