

Question: please see the chart to solve the problems and show all work. thank you! 2a) From the data in the previous problem, run a regression
 please see the chart to solve the problems and show all work. thank you!
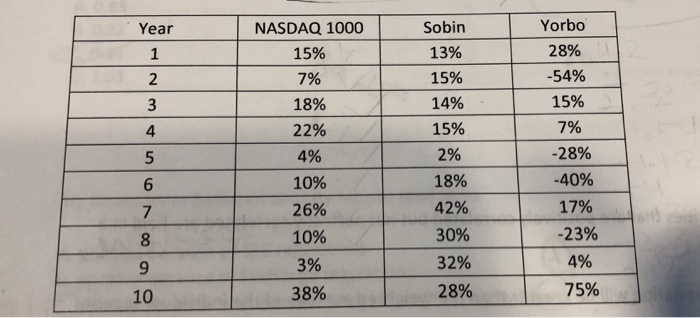
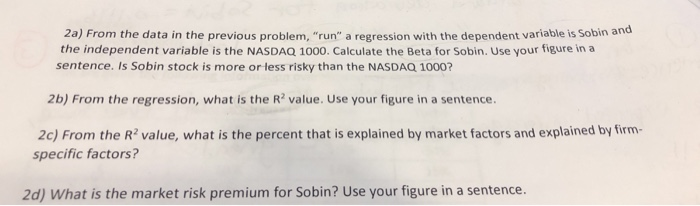
2a) From the data in the previous problem, "run" a regression with the dependent variable is Sobin and the independent variable is the NASDAQ 1000. Calculate the Beta for Sobin. Use your figure in a sentence. Is Sobin stock is more or less risky than the NASDAQ 1000? 2b) From the regression, what is the R2 value. Use your figure in a sentence. 2c) From the R value, what is the percent that is explained by market factors and explained by firm- specific factors? 2d) What is the market risk premium for Sobin? Use your figure in a sentence
Step by Step Solution
There are 3 Steps involved in it
1 Expert Approved Answer
Step: 1 Unlock

Question Has Been Solved by an Expert!
Get step-by-step solutions from verified subject matter experts
Step: 2 Unlock
Step: 3 Unlock