

Question: please show all work all rought work as well Question 3 - (12 marks) The following table provides monthly sales ($1000) at a college bookstore.
please show all work all rought work as well 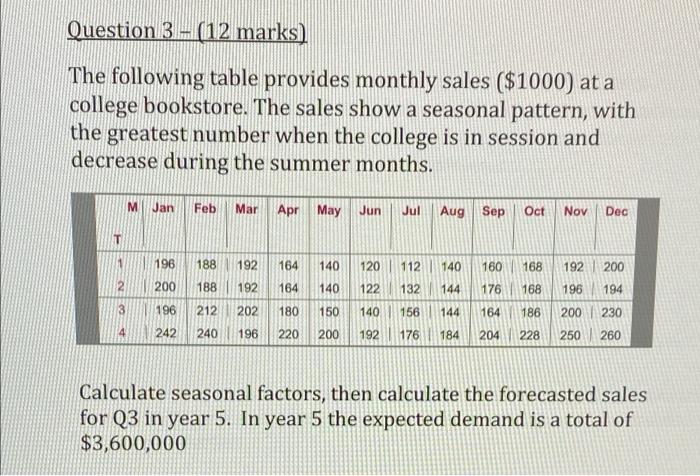
Question 3 - (12 marks) The following table provides monthly sales ($1000) at a college bookstore. The sales show a seasonal pattern, with the greatest number when the college is in session and decrease during the summer months. M Jan Feb Mar Apr May Jun Jul Aug Sep Oct Nov Dec 1 196 188 192 164 140 120 112 140 160 168 192 200 2 200 188 192 164 140 122 132 144 176 168 196 194 3 196 212 202 180 150 140 156 144 164 186 200 230 4 242 240 196 220 200 192 176 184 204 228 250 260 Calculate seasonal factors, then calculate the forecasted sales for Q3 in year 5. In year 5 the expected demand is a total of $3,600,000 Step by Step Solution
There are 3 Steps involved in it
1 Expert Approved Answer
Step: 1 Unlock

Question Has Been Solved by an Expert!
Get step-by-step solutions from verified subject matter experts
Step: 2 Unlock
Step: 3 Unlock