

Question: PLEASE SHOW IN EXCEL AND EXPLAIN FORMULAS 46. In many queueing situations, the time between arrivals and service times are assumed to have exponential dis.
PLEASE SHOW IN EXCEL AND EXPLAIN FORMULAS
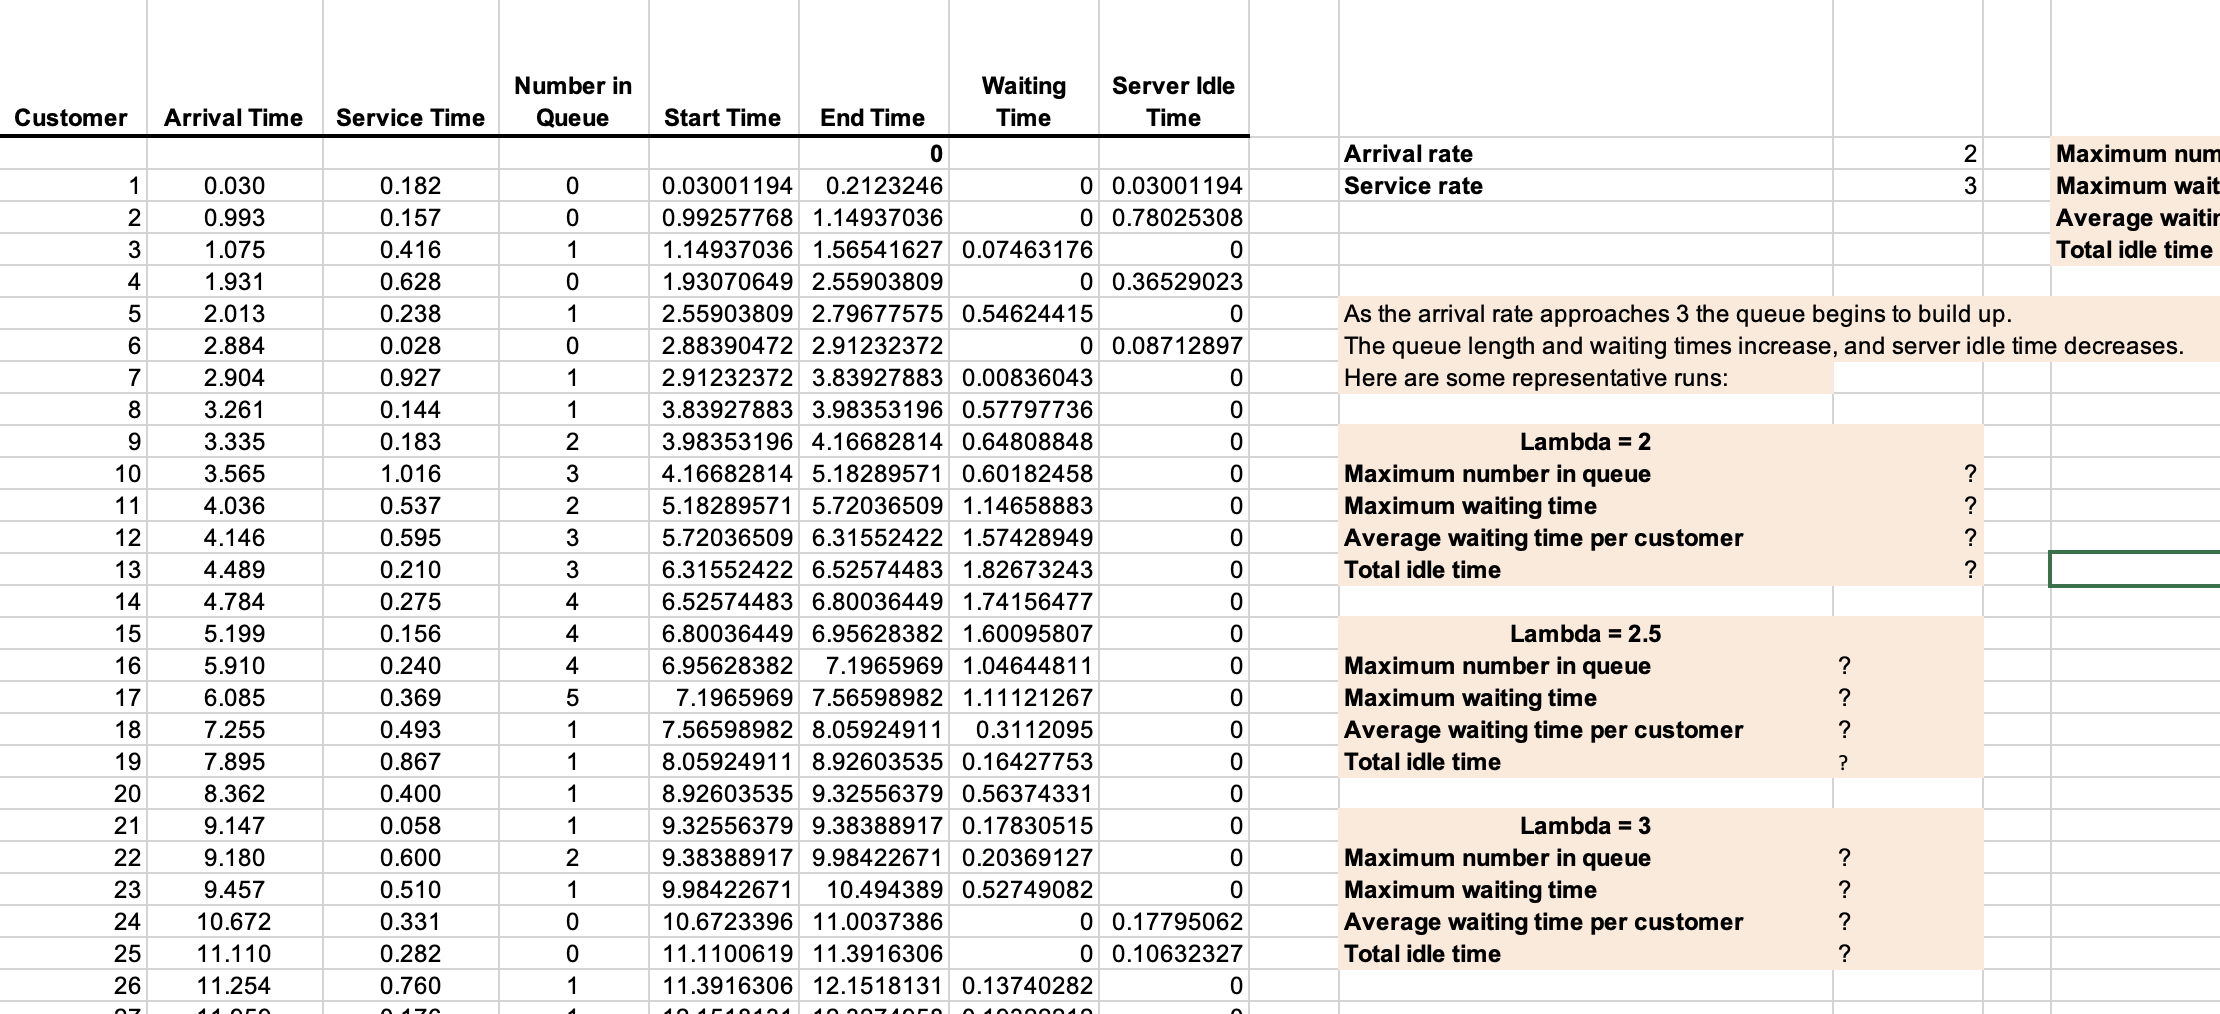
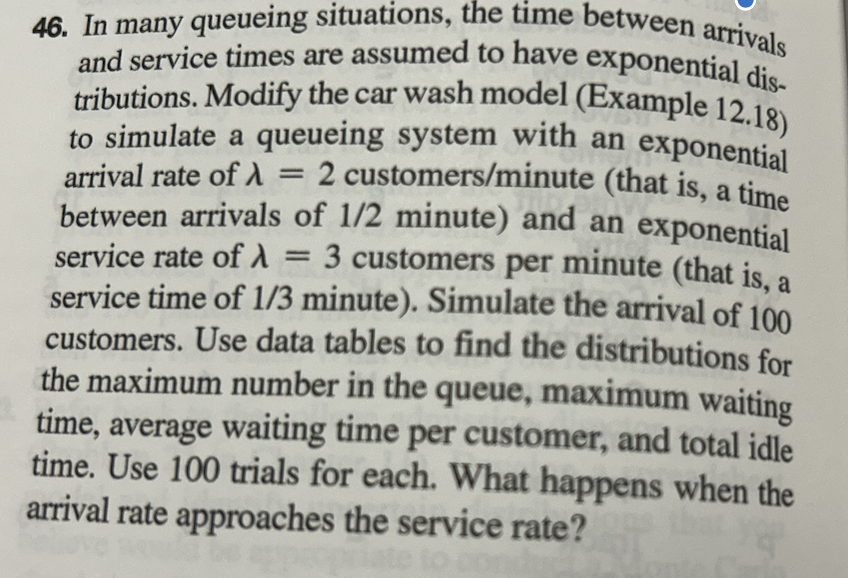
46. In many queueing situations, the time between arrivals and service times are assumed to have exponential dis. tributions. Modify the car wash model (Example 12.18) to simulate a queueing system with an exponential arrival rate of =2 customers/minute (that is, a time between arrivals of 1/2 minute) and an exponential service rate of =3 customers per minute (that is, a service time of 1/3 minute). Simulate the arrival of 100 customers. Use data tables to find the distributions for the maximum number in the queue, maximum waiting time, average waiting time per customer, and total idle time. Use 100 trials for each. What happens when the arrival rate approaches the service rate? \begin{tabular}{|c|c|c|c|c|c|c|c|c|c|c|c|} \hline & \begin{tabular}{l} Maximum \\ Number in \\ Queue \end{tabular} & & \begin{tabular}{l} Maximum \\ waiting time \end{tabular} & & \begin{tabular}{l} Average \\ waiting time \\ per \\ customer \end{tabular} & & \begin{tabular}{l} Total idle \\ time \end{tabular} & \begin{tabular}{l} Maximum \\ Number in \\ Queue \end{tabular} & & \begin{tabular}{l} Maximum \\ waiting time \end{tabular} & \\ \hline Trial & 7 & Trial & 2.71391167 & Trial & 0.52267279 & Trial & 17.5849004 & & & & \\ \hline 1 & & 1 & & 1 & & 1 & & Minimum & 0 & Minimum & \\ \hline 2 & & 2 & & 2 & & 2 & & Maximum & 0 & Maximum & \\ \hline 3 & & 3 & & 3 & & 3 & & & & & \\ \hline 4 & & 4 & & 4 & & 4 & & Bi & Frequency & Bin & Cum. Fr \\ \hline 5 & & 5 & & 5 & & 5 & & & 0 & 5 & \\ \hline 6 & & 6 & & 6 & & 6 & & & 0 & 10 & \\ \hline 7 & & 7 & & 7 & & 7 & & & 0 & 15 & \\ \hline 8 & & 8 & & 8 & & 8 & & & 0 & 20 & \\ \hline 9 & & 9 & & 9 & & 9 & & & 0 & 25 & \\ \hline 10 & & 10 & & 10 & & 10 & & & 0 & 30 & \\ \hline 11 & & 11 & & 11 & & 11 & & & 0 & 35 & \\ \hline 12 & & 12 & & 12 & & 12 & & & 0 & 40 & \\ \hline 13 & & 13 & & 13 & & 13 & & & 0 & 45 & \\ \hline 14 & & 14 & & 14 & & 14 & & & 0 & 50 & \\ \hline 15 & & 15 & & 15 & & 15 & & 1 & 0 & 55 & \\ \hline 16 & & 16 & & 16 & & 16 & & 1 & 0 & 60 & \\ \hline 17 & & 17 & & 17 & & 17 & & 1 & 0 & 65 & \\ \hline 18 & & 18 & & 18 & & 18 & & 1. & 0 & 70 & \\ \hline 19 & & 19 & & 19 & & 19 & & 1 & 0 & 75 & \\ \hline 20 & & 20 & & 20 & & 20 & & 1 & 0 & 80 & \\ \hline 21 & & 21 & & 21 & & 21 & & & & & \\ \hline 22 & & 22 & & 22 & & 22 & & \multirow{2}{*}{\multicolumn{4}{|c|}{ Max. Number in Queue }} \\ \hline 23 & & 23 & & 23 & & 23 & & & & & \\ \hline 24 & & 24 & & 24 & & 24 & & \\ \hline 25 & & 25 & & 25 & & 25 & & \multirow{2}{*}{\multicolumn{4}{|c|}{25}} \\ \hline 26 & & 26 & & 26 & & 26 & & & & & \\ \hline 27 & & 27 & & 27 & & 27 & & \multirow{2}{*}{\multicolumn{4}{|c|}{20}} \\ \hline 28 & & 28 & & 28 & & 20 & & & & & \\ \hline \end{tabular}
Step by Step Solution
There are 3 Steps involved in it

Get step-by-step solutions from verified subject matter experts