

Question: PLEASE SHOW THE ALL STEPS N EXCEL PLEASE As you can see in the following table, demand for heart transplant surgery at Washington General Hospital
PLEASE SHOW THE ALL STEPS N EXCEL PLEASE
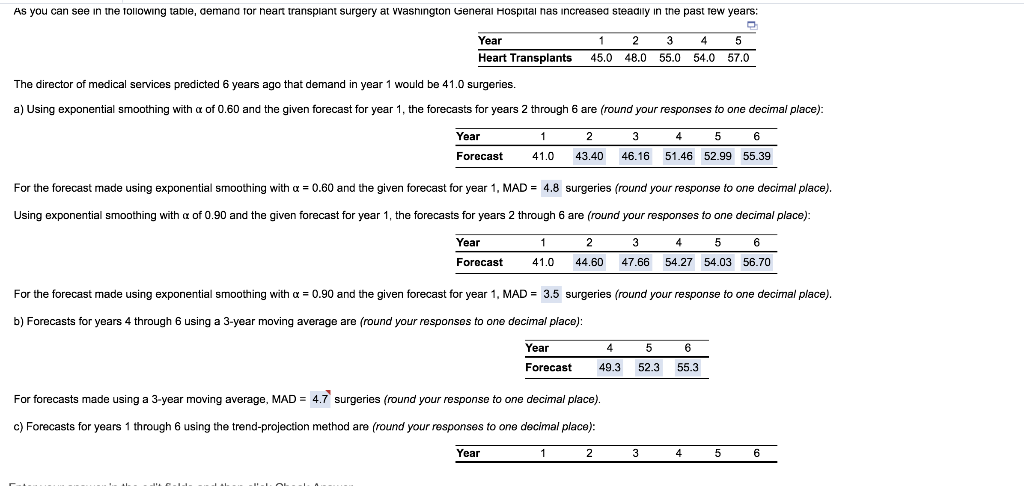
As you can see in the following table, demand for heart transplant surgery at Washington General Hospital nas increased steadily in the past few years: Year 1 45.0 2 48.0 3 55.0 4 5 54.0 57.0 Heart Transplants The director of medical services predicted 6 years ago that demand in year 1 would be 41.0 surgeries. a) Using exponential smoothing with a of 0.60 and the given forecast for year 1, the forecasts for years 2 through 6 are (round your responses to one decimal place): Year Forecast 1 41.0 2 43.40 3 46.16 4 5 6 51.46 52.99 55.39 For the forecast made using exponential smoothing with a = 0.60 and the given forecast for year 1, MAD = 4.8 surgeries (round your response to one decimal place). Using exponential smoothing with a of 0,90 and the given forecast for year 1, the forecasts for years 2 through 6 are (round your responses to one decimal place): Year 1 2 3 4 5 6 Forecast 41.0 44.60 47.66 54.27 54.03 56.70 For the forecast made using exponential smoothing with a = 0.90 and the given forecast for year 1, MAD = 3.5 surgeries (round your response to one decimal place). b) Forecasts for years 4 through 6 using a 3-year moving average are (round your responses to one decimal place): Year Forecast 4 49.3 5 52.3 6 55.3 For forecasts made using a 3-year moving average, MAD = 4.7 surgeries (round your response to one decimal place). c) Forecasts for years 1 through 6 using the trend-projection method are (round your responses to one decimal place): Year 1 2 3 4 5 6Step by Step Solution
There are 3 Steps involved in it
1 Expert Approved Answer
Step: 1 Unlock

Question Has Been Solved by an Expert!
Get step-by-step solutions from verified subject matter experts
Step: 2 Unlock
Step: 3 Unlock