

Question: Please show work by hand 1. Illustrate the changes in the critical values for a t test between a one-tailed (directional) hypothesis test and two-tailed
Please show work by hand
1. Illustrate the changes in the critical values for a ttest between a one-tailed (directional) hypothesis test and two-tailed (nondirectional) hypothesis test (usinga = .05 and df = 8) in diagrams. Draw the diagrams to illustrate how this changes the rejection regions and the critical values of t associated with the rejection regions.
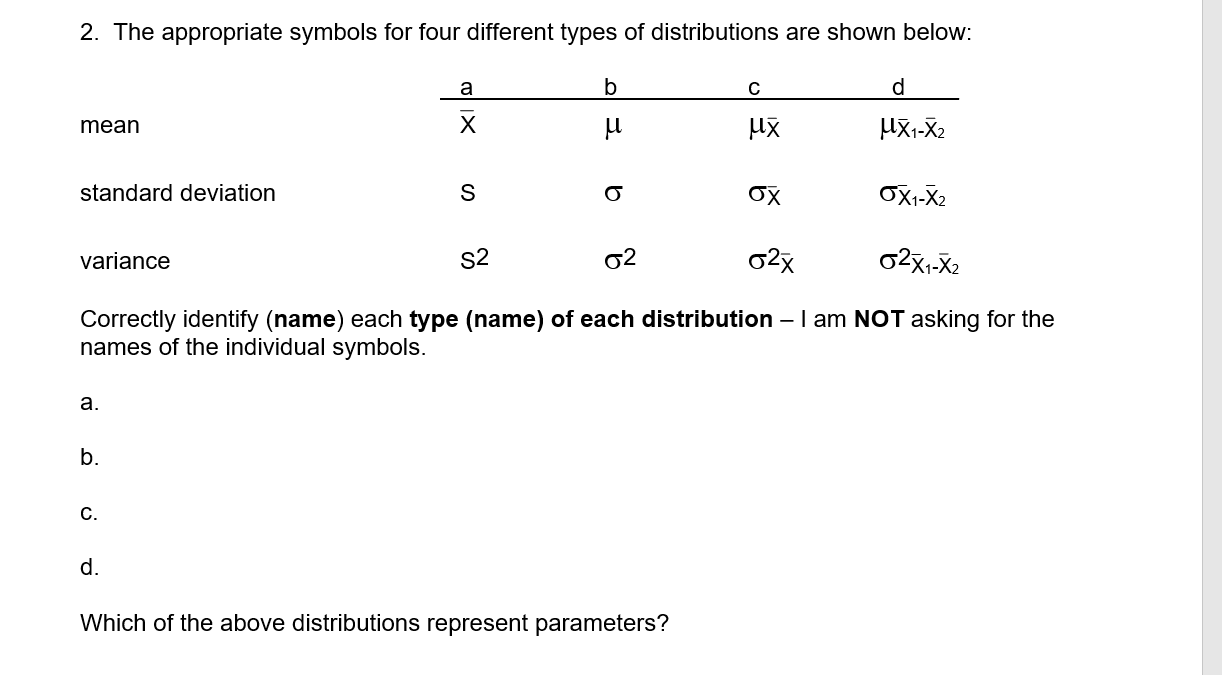
2. The appropriate symbols for four different types of distributions are shown below: a b c d mean X H Hi Mil-i2 standard deviation 8 0' (Ti 059.39 variance 82 0'2 0'22 0221-22 Correctly identify (name) each type (name) of each distribution I am NOT asking for the names of the individual symbols. a. b. c. d. Which of the above distributions represent parameters
Step by Step Solution
There are 3 Steps involved in it

Get step-by-step solutions from verified subject matter experts