

Question: Please show your work! Using the data given below, please graph the expected return and standard deviation for 3 portfolios using the 3 different correlations
Please show your work! 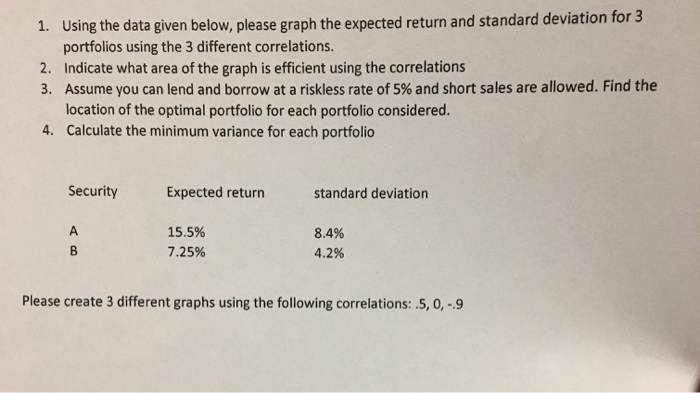
Using the data given below, please graph the expected return and standard deviation for 3 portfolios using the 3 different correlations 1. 2. Indicate what area of the graph is efficient using the correlations 3, Assume you can lend and borrow at a riskless rate of 5% and short sales are allowed. Find the location of the optimal portfolio for each portfolio considered. Calculate the minimum variance for each portfolio 4. Security Expected returtn standard deviation 15.5% 7.25% 8.4% 4.2% Please create 3 different graphs using the following correlations: .5, 0,-9
Step by Step Solution
There are 3 Steps involved in it
1 Expert Approved Answer
Step: 1 Unlock

Question Has Been Solved by an Expert!
Get step-by-step solutions from verified subject matter experts
Step: 2 Unlock
Step: 3 Unlock