

Question: 1. Using the data given below, please graph the expected return and standard deviation for 3 portfolios using the 3 different correlations. 2. Indicate what
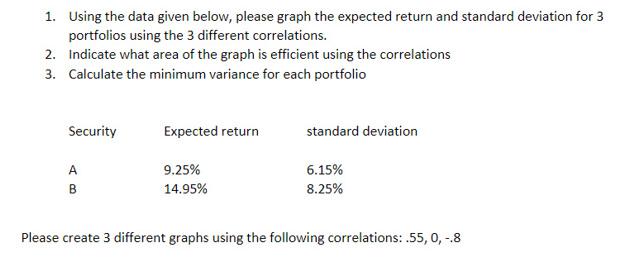
1. Using the data given below, please graph the expected return and standard deviation for 3 portfolios using the 3 different correlations. 2. Indicate what area of the graph is efficient using the correlations 3. Calculate the minimum variance for each portfolio Security Expected return standard deviation A B 9.25% 14.95% 6.15% 8.25% Please create 3 different graphs using the following correlations:.55,0,-8 1. Using the data given below, please graph the expected return and standard deviation for 3 portfolios using the 3 different correlations. 2. Indicate what area of the graph is efficient using the correlations 3. Calculate the minimum variance for each portfolio Security Expected return standard deviation A B 9.25% 14.95% 6.15% 8.25% Please create 3 different graphs using the following correlations:.55,0,-8
Step by Step Solution
There are 3 Steps involved in it

Get step-by-step solutions from verified subject matter experts