

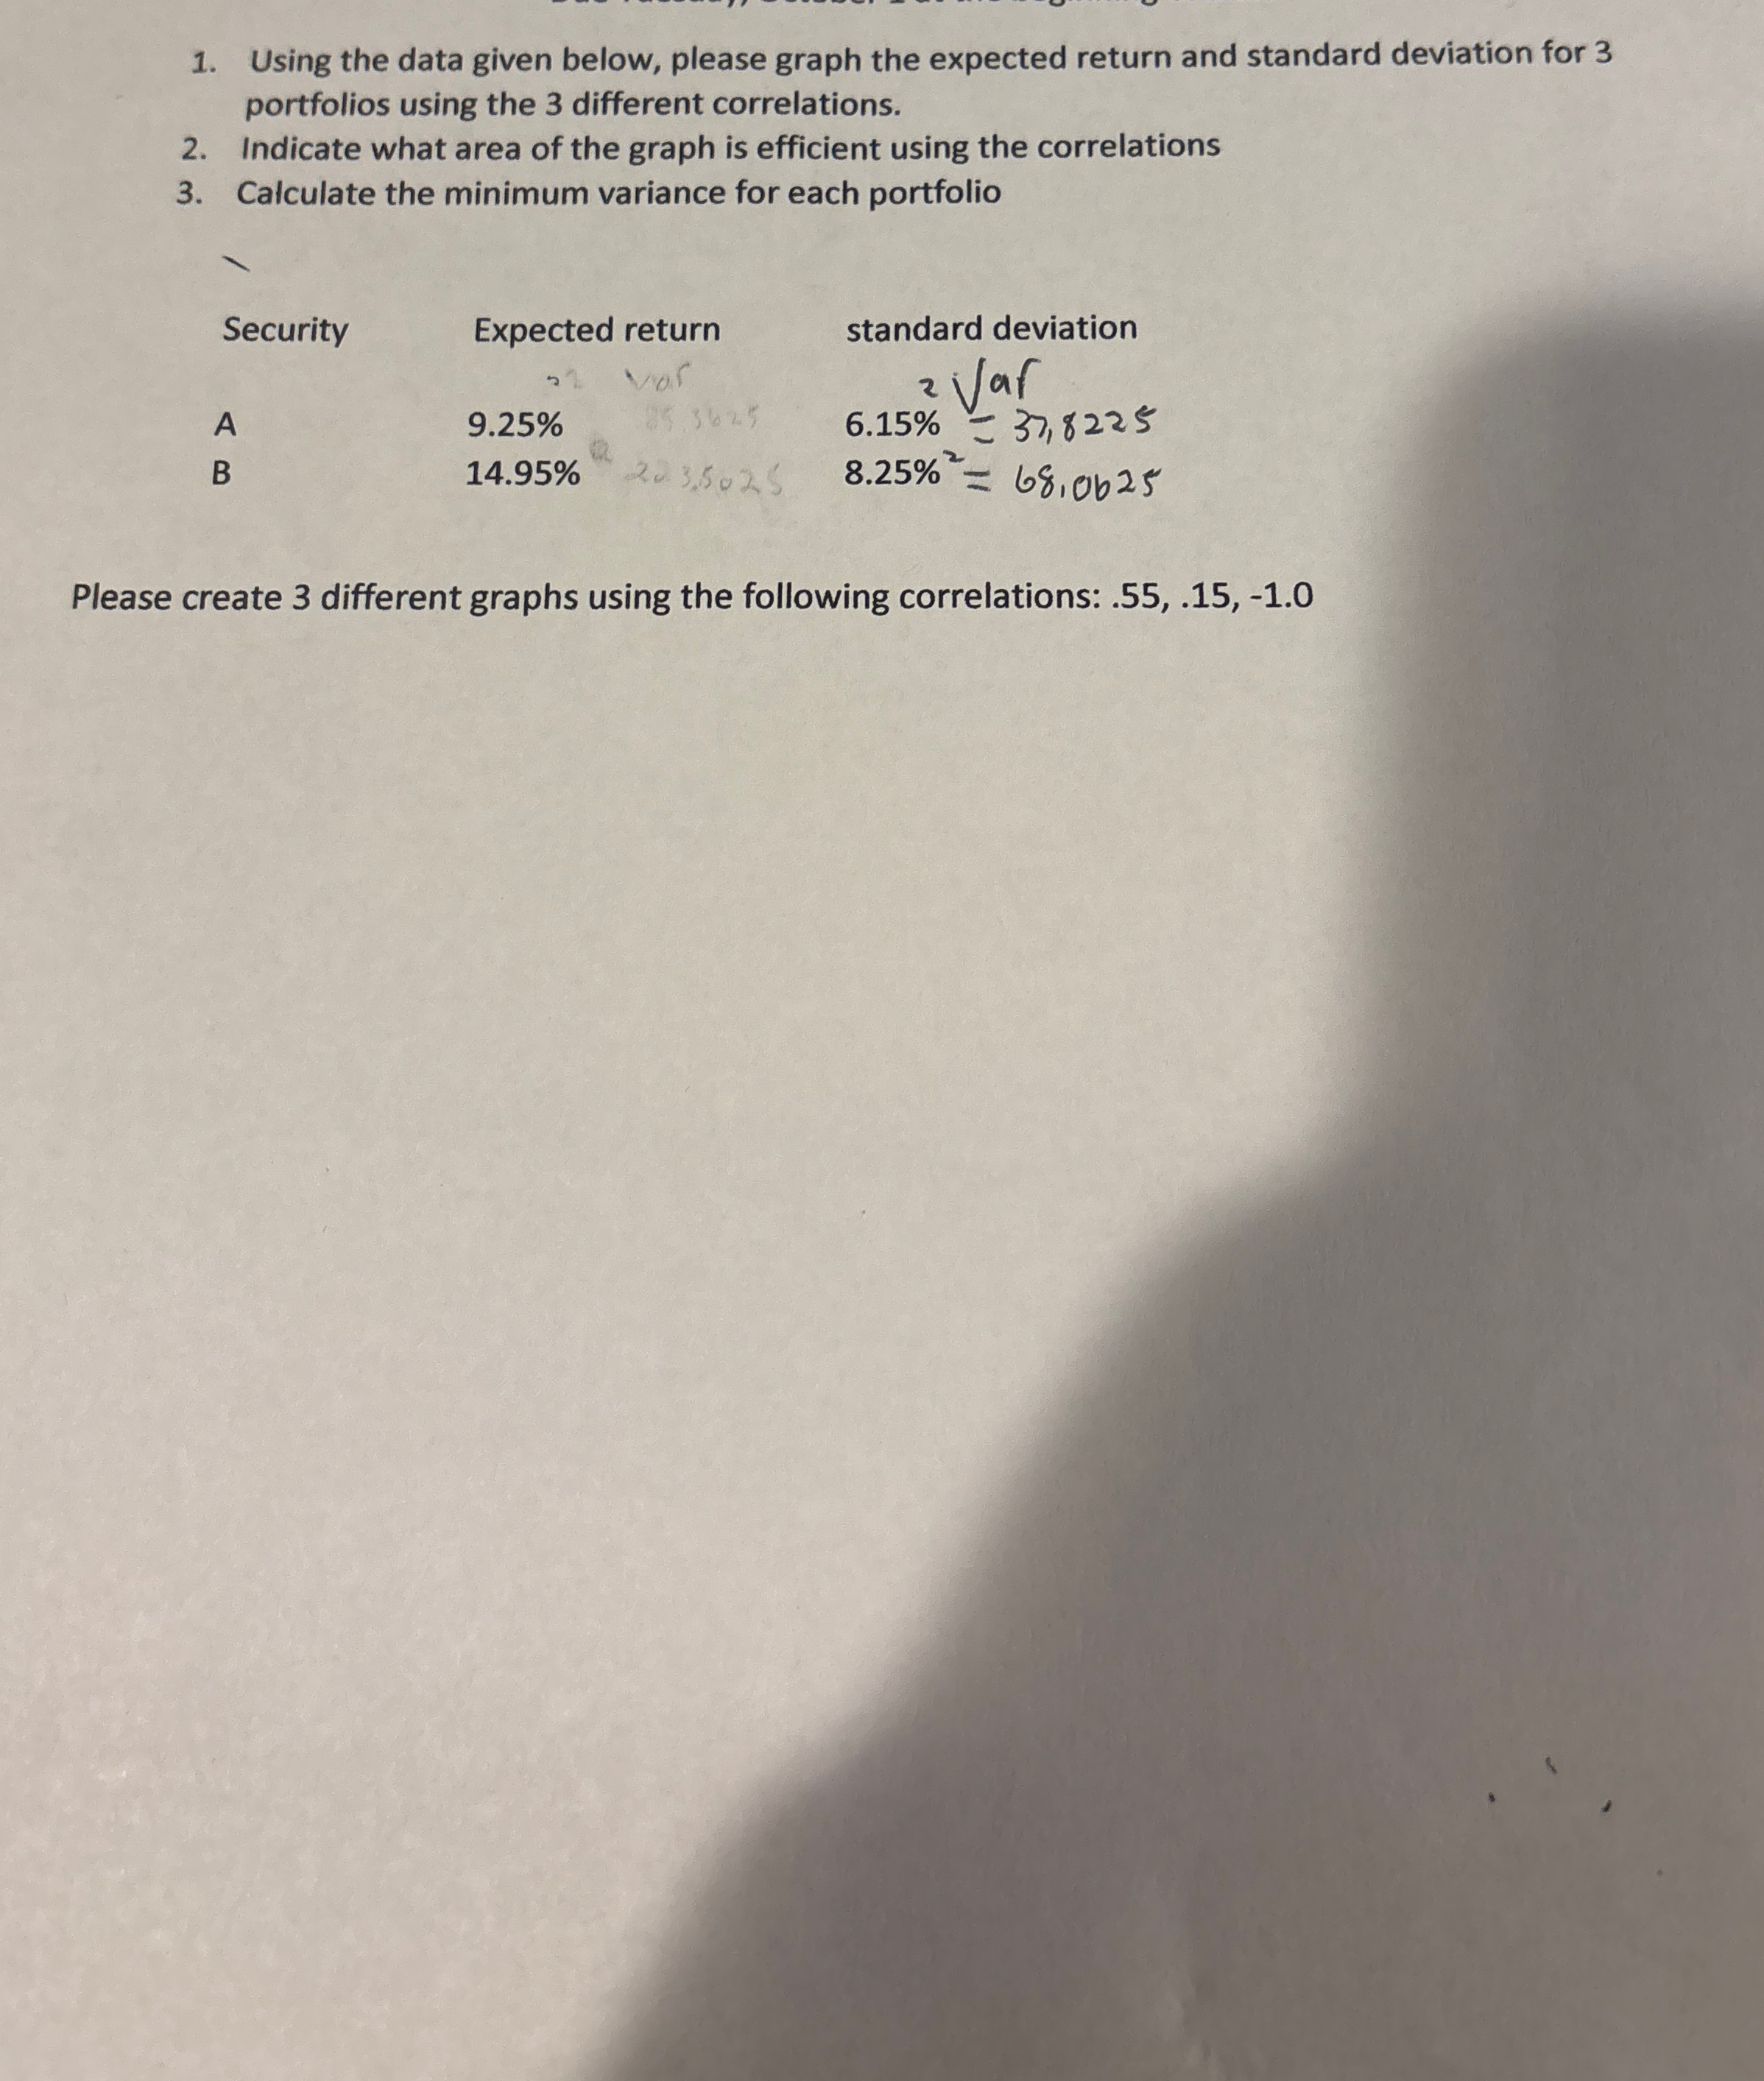
Question: Using the data given below, please graph the expected return and standard deviation for 3 portfolios using the 3 different correlations. Indicate what area of
Using the data given below, please graph the expected return and standard deviation for
portfolios using the different correlations.
Indicate what area of the graph is efficient using the correlations
Calculate the minimum variance for each portfolio
Please create different graphs using the following correlations:
Step by Step Solution
There are 3 Steps involved in it
1 Expert Approved Answer
Step: 1 Unlock

Question Has Been Solved by an Expert!
Get step-by-step solutions from verified subject matter experts
Step: 2 Unlock
Step: 3 Unlock