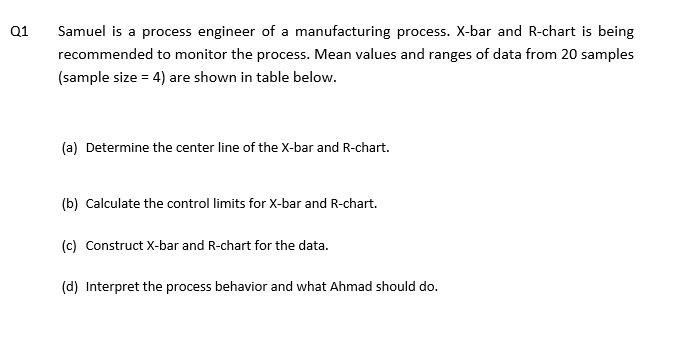
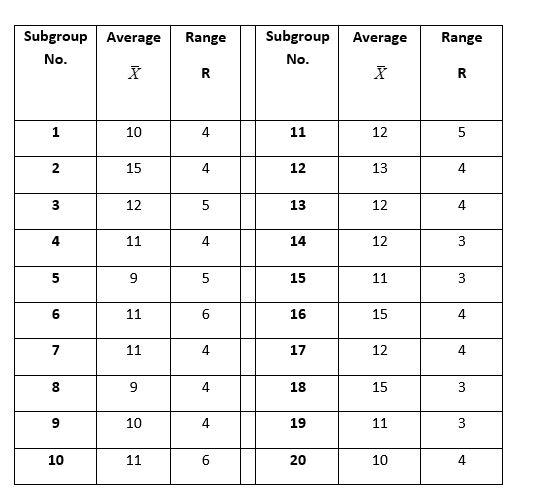
Question: Q1 Samuel is a process engineer of a manufacturing process. X-bar and R-chart is being recommended to monitor the process. Mean values and ranges of

Q1 Samuel is a process engineer of aQ1 Samuel is a process engineer of a

Q1 Samuel is a process engineer of a manufacturing process. X-bar and R-chart is being recommended to monitor the process. Mean values and ranges of data from 20 samples (sample size = 4) are shown in table below. (a) Determine the center line of the X-bar and R-chart. (b) Calculate the control limits for X-bar and R-chart. (c) Construct X-bar and R-chart for the data. (d) Interpret the process behavior and what Ahmad should do. Subgroup Average No. Range Average Subgroup No. Range R R 1 10 4 st 11 12 5 2 15 4 12 13 4 3 12 5 13 12 4 11 4 14 12 3 UT 9 15 11 3 6 11 6 16 15 4 7 11 4 17 12 4 4 8 co 9 4 18 15 3 3 9 10 4 19 11 3 10 11 20 10 4

Step by Step Solution

There are 3 Steps involved in it

1 Expert Approved Answer
Step: 1 Unlock blur-text-image
Question Has Been Solved by an Expert!

Get step-by-step solutions from verified subject matter experts

Step: 2 Unlock
Step: 3 Unlock

Students Have Also Explored These Related General Management Questions!