

Question: help A Quality Analyst wants to construct a control chart for determining whether three machines, all producing the same product, are under cartroi with regard
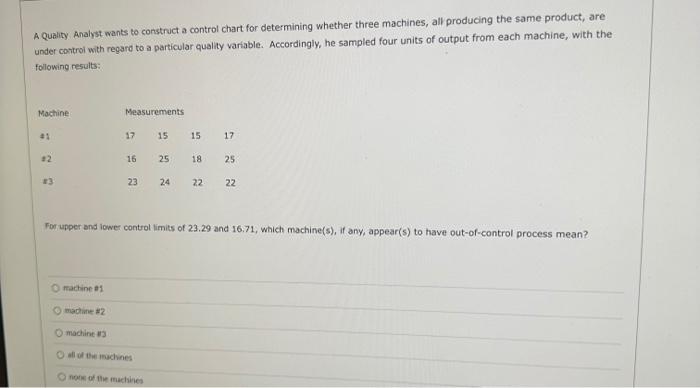
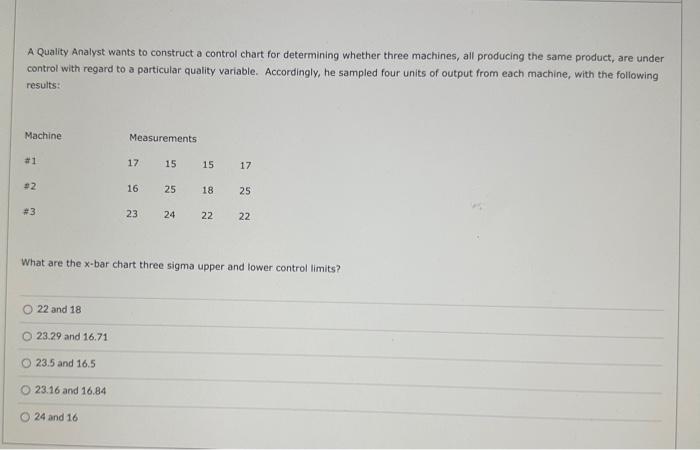
A Quality Analyst wants to construct a control chart for determining whether three machines, all producing the same product, are under cartroi with regard to a particular quality variable. Accordingly, he sampled four units of output from each machine, with the following results: For upper and lower control limits of 23.29 and 16.71 , which machine(s), if any, appear(s) to have out-of-control process mean? ractine A 1 machine * 2 machine 13 af of tor machines nowe of the machines A Quality Analyst wants to construct a control chart for determining whether three machines, all producing the same product, are under control with regard to a particular quality variable. Accordingly, he sampled four units of output from each machine, with the following results: What are the x-bar chart three sigma upper and lower control limits? 22 and 18 23.29 and 16.71 23.5 and 16.5 23.16 and 16.84 24 and 16
Step by Step Solution
There are 3 Steps involved in it

Get step-by-step solutions from verified subject matter experts