

Question: PLEASE SOLVE USING: MATLAB, R or PYTHON Problem 3. Consider the following unnormalized posterior: p(Oly) e-}{0:03+02 +0220162482403} where 0 R2. Plot the two-dimensional image of
PLEASE SOLVE USING: MATLAB, R or PYTHON
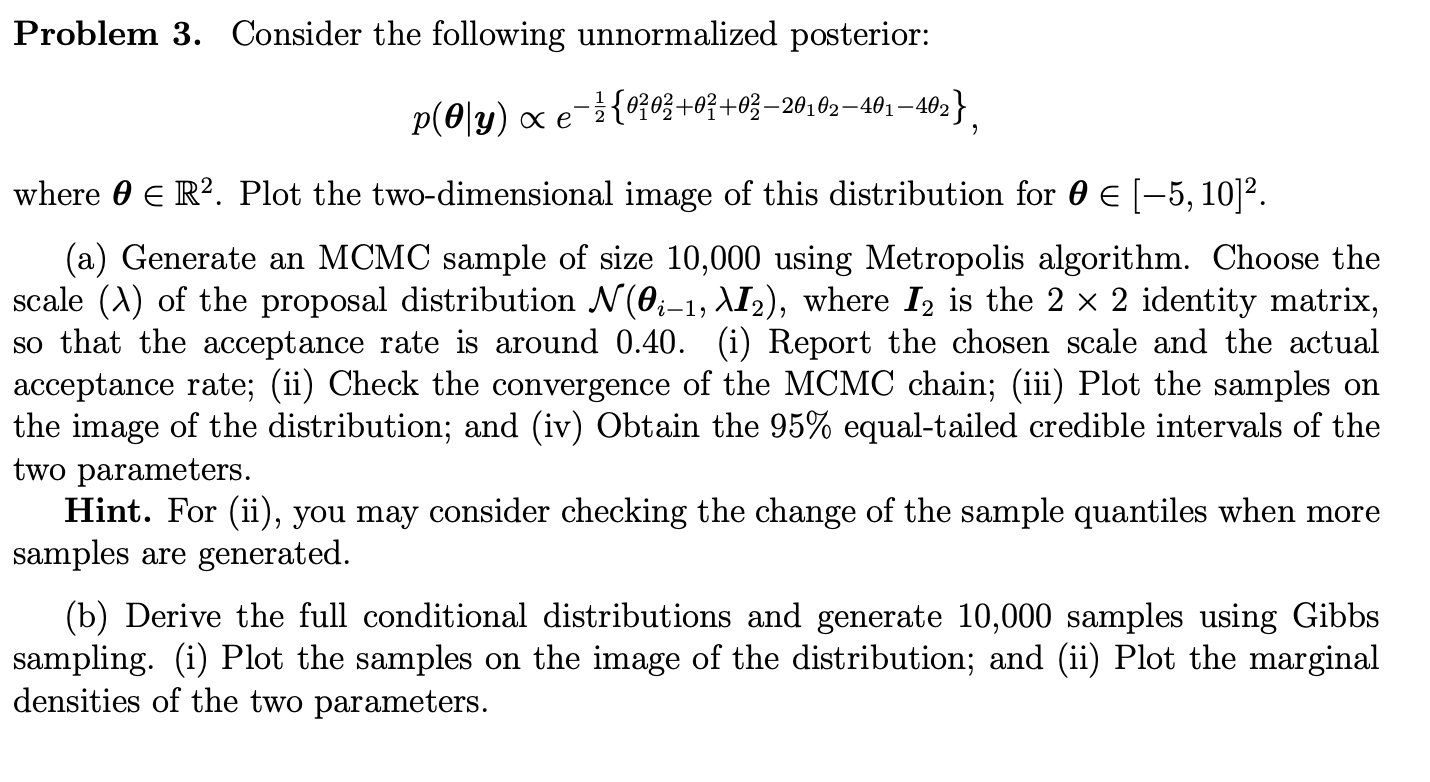
Problem 3. Consider the following unnormalized posterior: p(Oly) e-}{0:03+02 +0220162482403} where 0 R2. Plot the two-dimensional image of this distribution for 0 (-5, 1012. (a) Generate an MCMC sample of size 10,000 using Metropolis algorithm. Choose the scale (~) of the proposal distribution N(0:-1, \I2), where I2 is the 2 x 2 identity matrix, so that the acceptance rate is around 0.40. (i) Report the chosen scale and the actual acceptance rate; (ii) Check the convergence of the MCMC chain; (iii) Plot the samples on the image of the distribution; and (iv) Obtain the 95% equal-tailed credible intervals of the two parameters. Hint. For (ii), you may consider checking the change of the sample quantiles when more samples are generated. (b) Derive the full conditional distributions and generate 10,000 samples using Gibbs sampling. (i) Plot the samples on the image of the distribution; and (ii) Plot the marginal densities of the two parameters. Problem 3. Consider the following unnormalized posterior: p(Oly) e-}{0:03+02 +0220162482403} where 0 R2. Plot the two-dimensional image of this distribution for 0 (-5, 1012. (a) Generate an MCMC sample of size 10,000 using Metropolis algorithm. Choose the scale (~) of the proposal distribution N(0:-1, \I2), where I2 is the 2 x 2 identity matrix, so that the acceptance rate is around 0.40. (i) Report the chosen scale and the actual acceptance rate; (ii) Check the convergence of the MCMC chain; (iii) Plot the samples on the image of the distribution; and (iv) Obtain the 95% equal-tailed credible intervals of the two parameters. Hint. For (ii), you may consider checking the change of the sample quantiles when more samples are generated. (b) Derive the full conditional distributions and generate 10,000 samples using Gibbs sampling. (i) Plot the samples on the image of the distribution; and (ii) Plot the marginal densities of the two parameters
Step by Step Solution
There are 3 Steps involved in it

Get step-by-step solutions from verified subject matter experts