Question: please type your answer The following pie chart shows the percentages of contracts sold by each salesperson. 19.6% 12.1% Harish David 20.6% Kristina 26.6% Steven

please type your answer please type your answer The following pie chart
The following pie chart shows the percentages of contracts sold by each salesperson. 19.6% 12.1% Harish David 20.6% Kristina 26.6% Steven Tim 9.5% Mona 11.6% a. What are the problems with using a pie chart to display these data? b. What type of chart would be preferred for displaying the data in this pie chart? c. Use a different type of chart to display the percentage of contracts sold by each salespe that conveys the data better than the pie chart. Format the chart and add data labels to improve the chart's readability

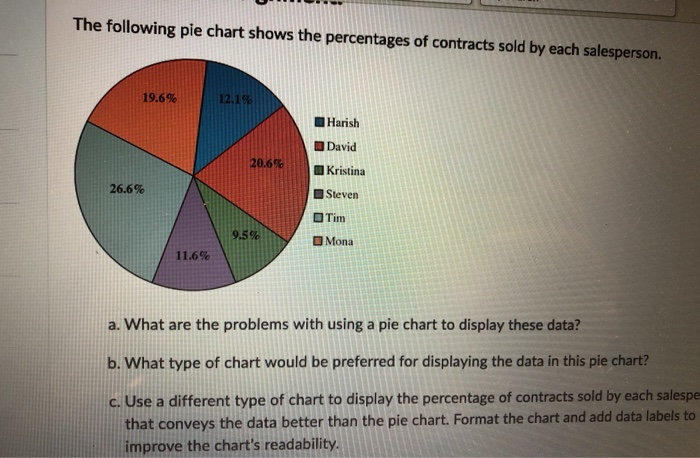
Step by Step Solution

There are 3 Steps involved in it

1 Expert Approved Answer
Step: 1 Unlock blur-text-image
Question Has Been Solved by an Expert!

Get step-by-step solutions from verified subject matter experts

Step: 2 Unlock
Step: 3 Unlock

Students Have Also Explored These Related General Management Questions!