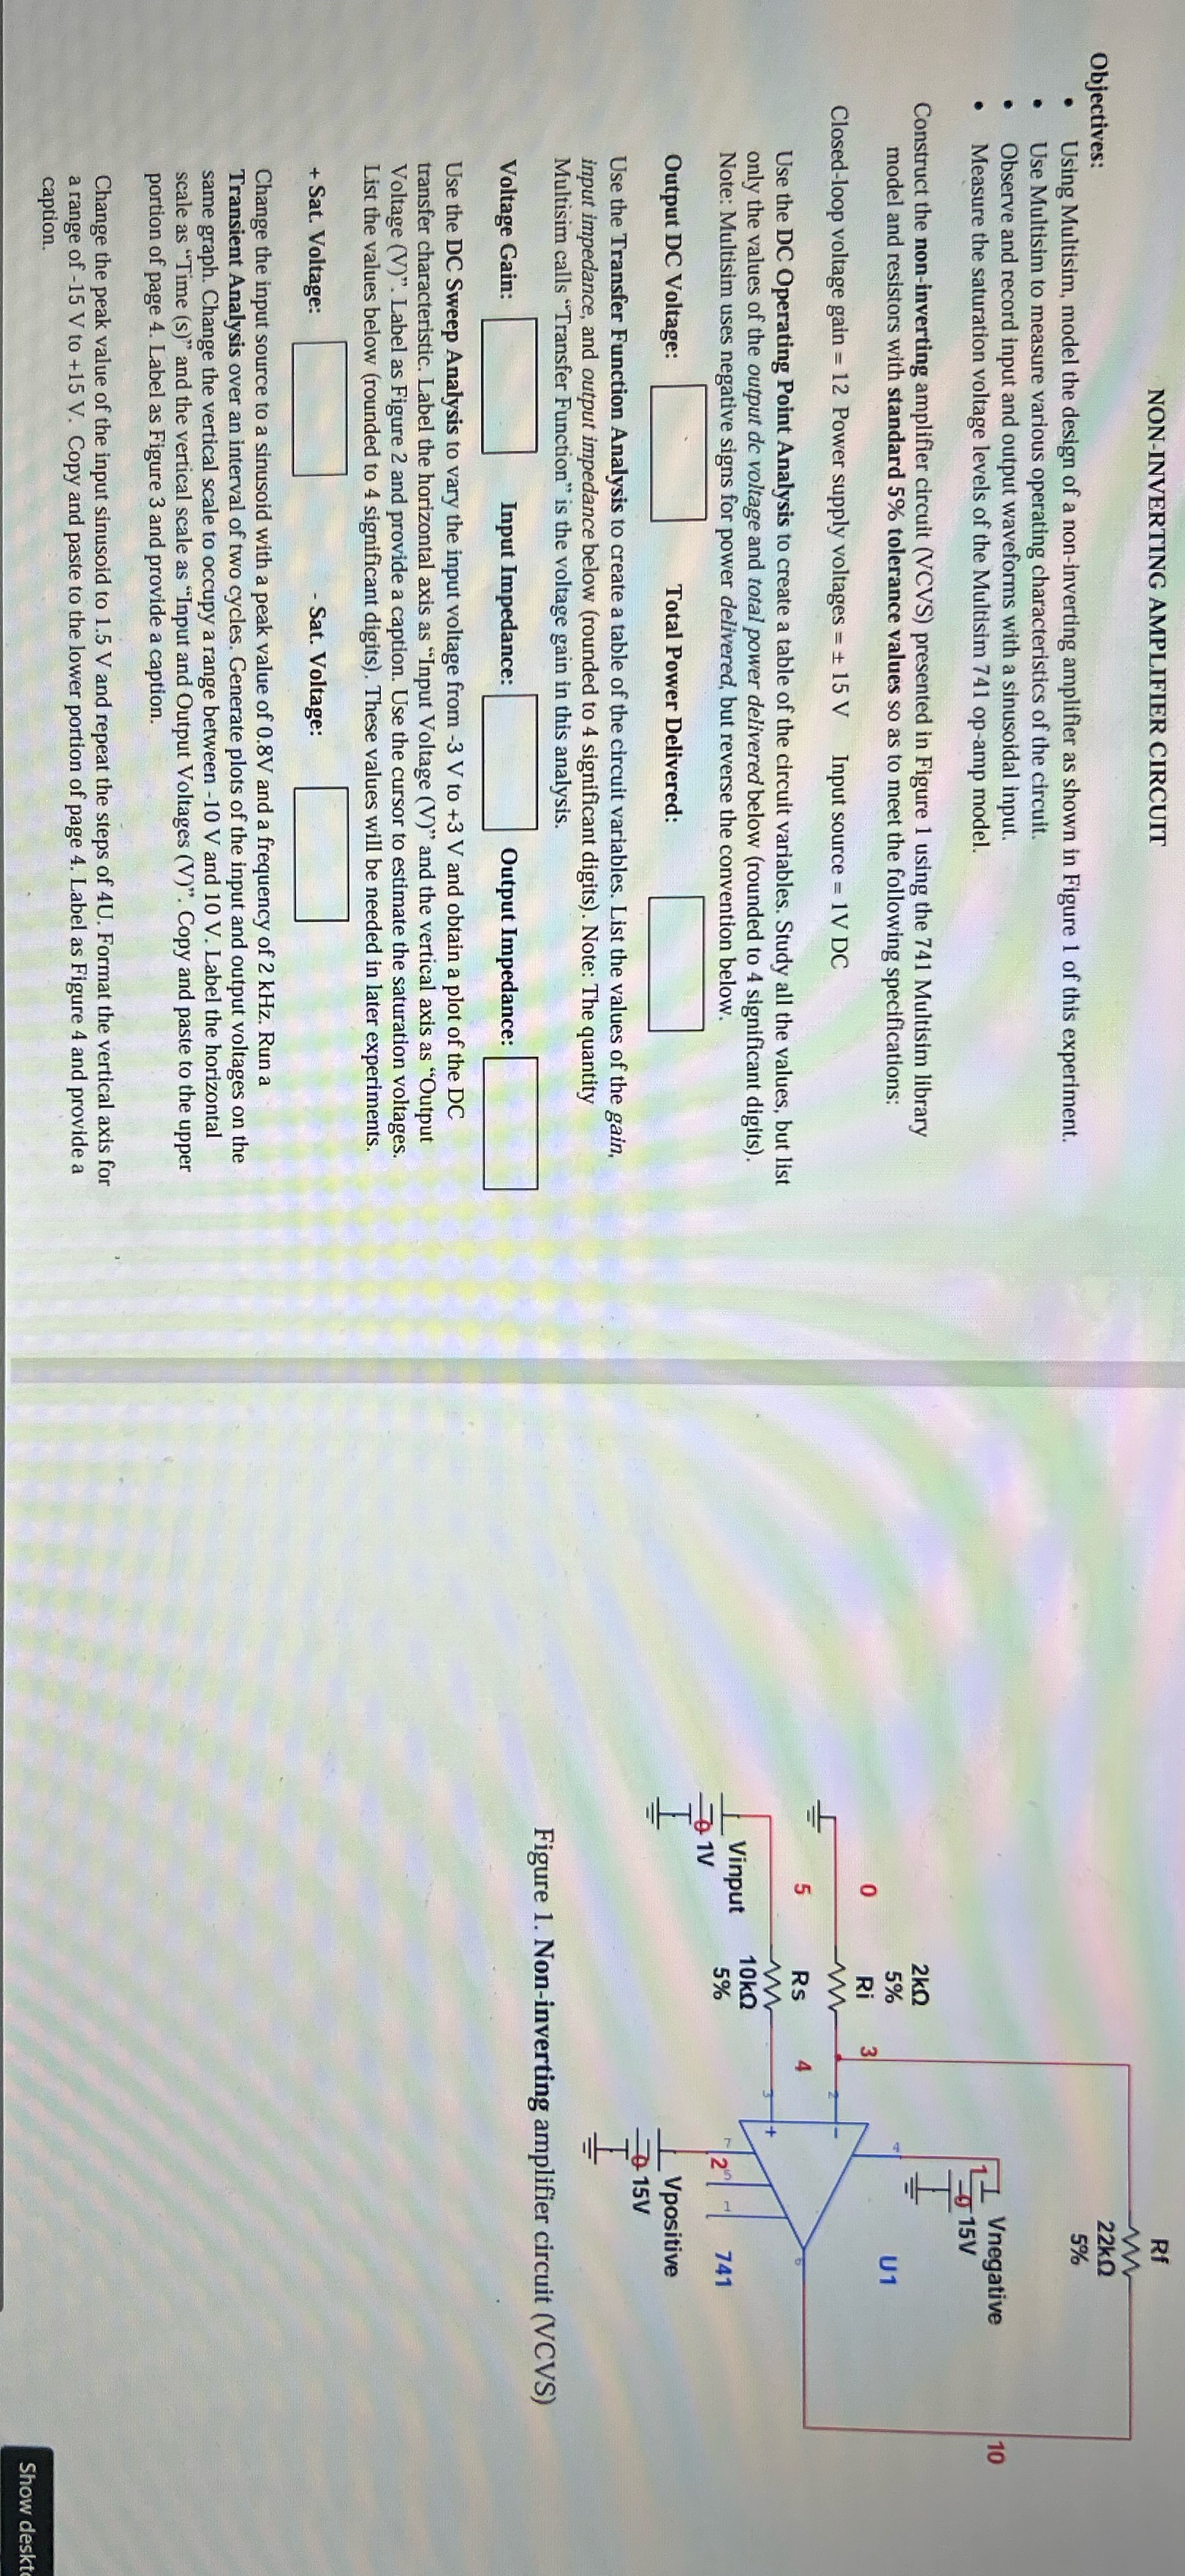
Question: Please use and build in Multisim for the required objective NON-INVERTING AMPLIFIER CIRCUIT Objectives: 22kQ Using Multisim, model the design of a non-inverting amplifier as

Please use and build in Multisim for the required objective

Please use and build in Multisim for the required
NON-INVERTING AMPLIFIER CIRCUIT Objectives: 22kQ Using Multisim, model the design of a non-inverting amplifier as shown in Figure 1 of this experiment. 5% Use Multisim to measure various operating characteristics of the circuit. Observe and record input and output waveforms with a sinusoidal input. Measure the saturation voltage levels of the Multisim 741 op-amp model. I Vnegative 15V Construct the non-inverting amplifier circuit (VCVS) presented in Figure 1 using the 741 Multisim library HI 2KQ model and resistors with standard 5% tolerance values so as to meet the following specifications: 5% 5 Closed-loop voltage gain = 12 Power supply voltages = + 15 V Input source = 1V DC Use the DC Operating Point Analysis to create a table of the circuit variables. Study all the values, but list RS only the values of the output de voltage and total power delivered below (rounded to 4 significant digits). Note: Multisim uses negative signs for power delivered, but reverse the convention below. Vinput 10kQ 5% 741 Output DC Voltage: Total Power Delivered: Vpositive 15V Use the Transfer Function Analysis to create a table of the circuit variables. List the values of the gain, input impedance, and output impedance below (rounded to 4 significant digits). Note: The quantity Multisim calls "Transfer Function" is the voltage gain in this analysis. Figure 1. Non-inverting amplifier circuit (VCVS) Voltage Gain: Input Impedance: Output Impedance: Use the DC Sweep Analysis to vary the input voltage from -3 V to +3 V and obtain a plot of the DC transfer characteristic. Label the horizontal axis as "Input Voltage (V)" and the vertical axis as "Output Voltage (V)". Label as Figure 2 and provide a caption. Use the cursor to estimate the saturation voltages. List the values below (rounded to 4 significant digits). These values will be needed in later experiments. + Sat. Voltage: Sat. Voltage: Change the input source to a sinusoid with a peak value of 0.8V and a frequency of 2 kHz. Run a Transient Analysis over an interval of two cycles. Generate plots of the input and output voltages on the same graph. Change the vertical scale to occupy a range between -10 V and 10 V. Label the horizontal scale as "Time (s)" and the vertical scale as "Input and Output Voltages (V)". Copy and paste to the upper portion of page 4. Label as Figure 3 and provide a caption. Change the peak value of the input sinusoid to 1.5 V and repeat the steps of 4U. Format the vertical axis for a range of -15 V to +15 V. Copy and paste to the lower portion of page 4. Label as Figure 4 and provide a caption. Show desk

Step by Step Solution

There are 3 Steps involved in it

1 Expert Approved Answer
Step: 1 Unlock blur-text-image
Question Has Been Solved by an Expert!

Get step-by-step solutions from verified subject matter experts

Step: 2 Unlock
Step: 3 Unlock

Students Have Also Explored These Related Accounting Questions!