

Question: Please use MATLAB. Write a script to determine the best function y(x) to describe the data given in table 1. Remember that the function polyfit
Please use MATLAB.
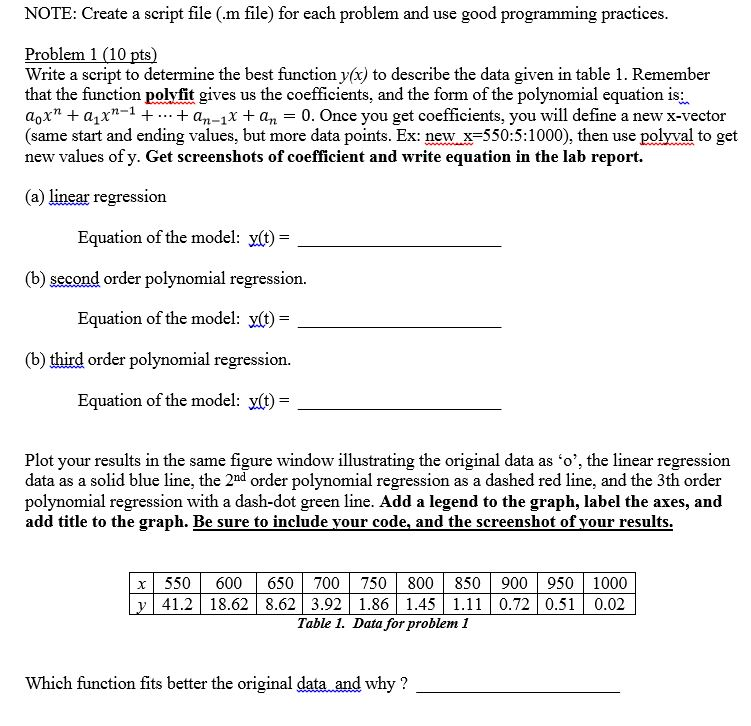
Write a script to determine the best function y(x) to describe the data given in table 1. Remember that the function polyfit gives us the coefficients, and the form of the polynomial equation is: a_0 x^n + a_1 x^n - 1 + ... +a_n - 1 x + a_n = 0. Once you get coefficients, you will define a new x-vector (same start and ending values, but more data points. Ex: new x = 550: 5: 10000), then use polyval to get new values of y. Get screenshots of coefficient and write equation in the lab report. (a) linear regression. Equation of the model: y(t) = ___________ (b) second order polynomial regression. Equation of the model: y(t) = ___________ (b) third order polynomial regression. Equation of the model: y(t) = ___________ Plot your results in the same figure window illustrating the original data as 'o', the linear regression data as a solid blue line, the 2^nd order polynomial regression as a dashed red line, and the 3th order polynomial regression with a dash-dot green line. Add a legend to the graph, label the axes, and add title to the graph. Be sure to include your code, and the screenshot of your results. Which function fits better the original data and why? ____________
Step by Step Solution
There are 3 Steps involved in it

Get step-by-step solutions from verified subject matter experts