

Question: Please use the Matlab to solve the problem, there is only one blank need to fill out. Figure File Edit View Insert Tools Desktop Window
Please use the Matlab to solve the problem, there is only one blank need to fill out.
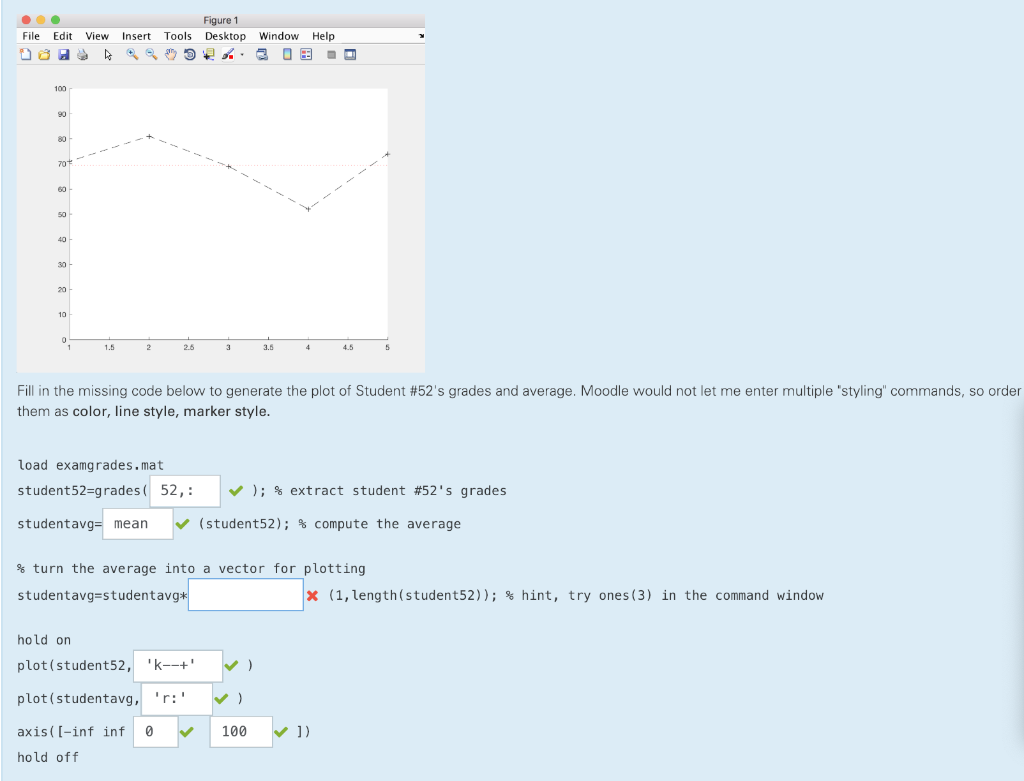
Figure File Edit View Insert Tools Desktop Window Help 90 70 60 40 20 1.5 2.6 3.6 Fill in the missing code below to generate the plot of Student #52's grades and average. Moodle would not let me enter multiple styling commands, so order them as color, line style, marker style load examgrades.mat student52-grades ( student avg- mean (student52); % compute the average % turn the average into a vector for plotting studentavg-studentavg 52, : ); % extract student #52's grades ( 1 , leng th (student52)); % hint, try ones (3) in the command window hold on plot(students2, plot ( studentavg , 'r:' ) axis(I-inf inf1001) hold off
Step by Step Solution
There are 3 Steps involved in it

Get step-by-step solutions from verified subject matter experts