

Question: please walk me through how to do this on SPSS! thank you height.sav [DataSet2] - IBM SPSS Statistics Data Editor File Edit View Data Transform
please walk me through how to do this on SPSS! thank you
![height.sav [DataSet2] - IBM SPSS Statistics Data Editor File Edit View Data](https://s3.amazonaws.com/si.experts.images/answers/2024/06/6679fd7d02b27_7806679fd7cdfdd5.jpg)
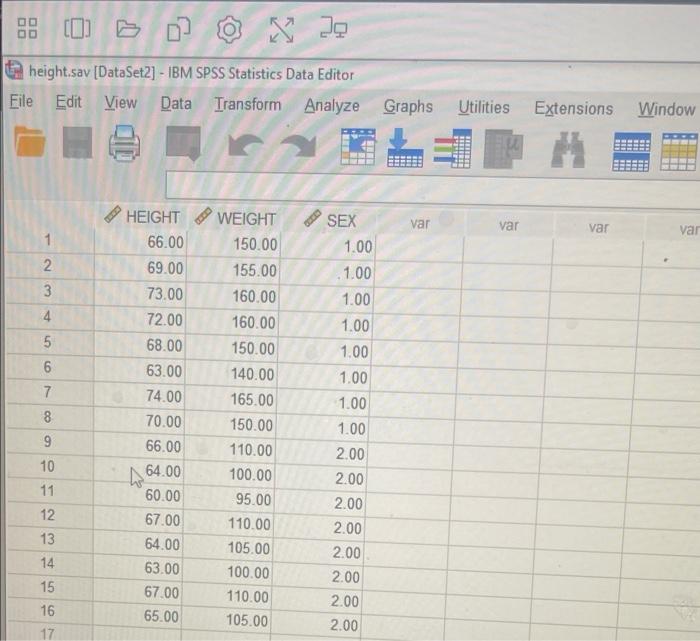
height.sav [DataSet2] - IBM SPSS Statistics Data Editor File Edit View Data Transform Analyze Graphs Utilities Extensions Window HEIGHT WEIGHT SEX var var var va 66.00 150.00 1.00 69.00 155.00 1.00 73.00 160.00 1.00 72.00 160.00 1.00 68.00 150.00 1.00 6 63.00 140.00 1.00 74.00 165.00 1.00 8 70.00 150.00 1.00 9 66.00 110.00 2.00 10 A 64.00 100.00 2.00 11 60.00 95.00 2.00 12 67.00 110.00 2.00 13 64.00 105.00 2.00 14 63.00 100.00 2.00 15 67.00 110.00 2.00 16 65.00 105.00 2.00 17#2. (4 points) Use height.sav dataset. Construct a scatterplot for HEIGHT (X-axis), WEIGHT (y-axis), and SEX (grouping variable). 43 (4 nointel Leads
Step by Step Solution
There are 3 Steps involved in it

Get step-by-step solutions from verified subject matter experts