

Question: please write the code that plot the graph using MATLAB. Xth _ xt-e (24) * 8* X* Considering the above function; in the range of
please write the code that plot the graph using MATLAB. 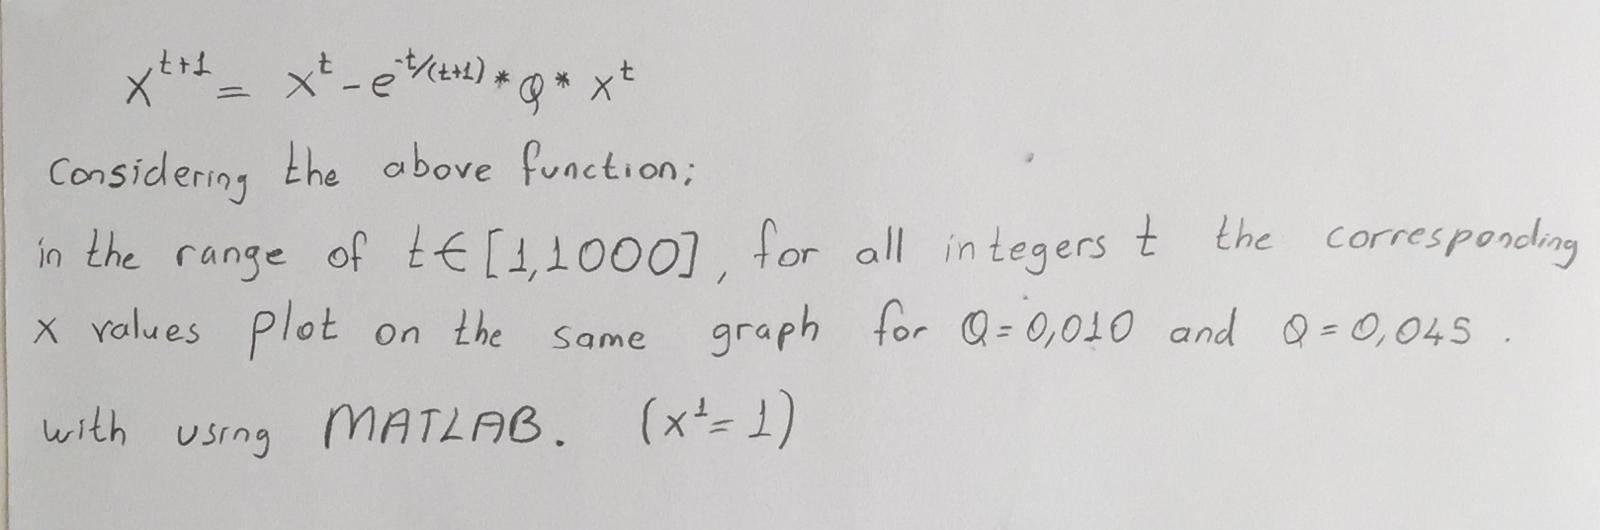
Xth _ xt-e (24) * 8* X* Considering the above function; in the range of t [1,1000], for all integers t the corresponding x values plot the graph for Q = 0,010 and Q = 0,045 . with MATLAB. (xt = 1) on Same using
Step by Step Solution
There are 3 Steps involved in it
1 Expert Approved Answer
Step: 1 Unlock

Question Has Been Solved by an Expert!
Get step-by-step solutions from verified subject matter experts
Step: 2 Unlock
Step: 3 Unlock