

Question: Please write the MATLAB code for this problem. I need it to output a graph that looks like figure 5 including x- and y-axis labels
Please write the MATLAB code for this problem. I need it to output a graph that looks like figure 5 including x- and y-axis labels and the root label on the graph, please.
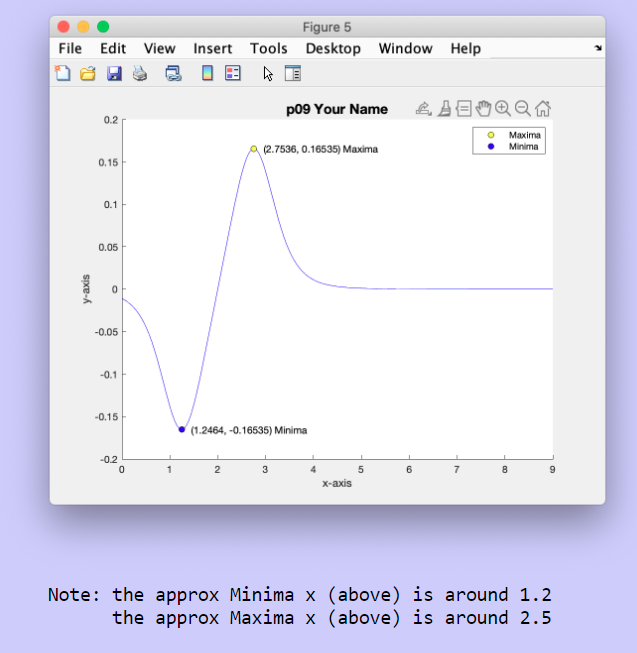
t-2 9. Determine the maxima and minima of the function f(x) = (1.2)*+2) 1.6 First create an anonymous function, then fplot in the domain 0
Step by Step Solution
There are 3 Steps involved in it
1 Expert Approved Answer
Step: 1 Unlock

Question Has Been Solved by an Expert!
Get step-by-step solutions from verified subject matter experts
Step: 2 Unlock
Step: 3 Unlock