

Question: Plesse help show work and explain fProblem set 1: Use the following data to answer questions [-4 (30 points): There is often thought to be
Plesse help show work and explain
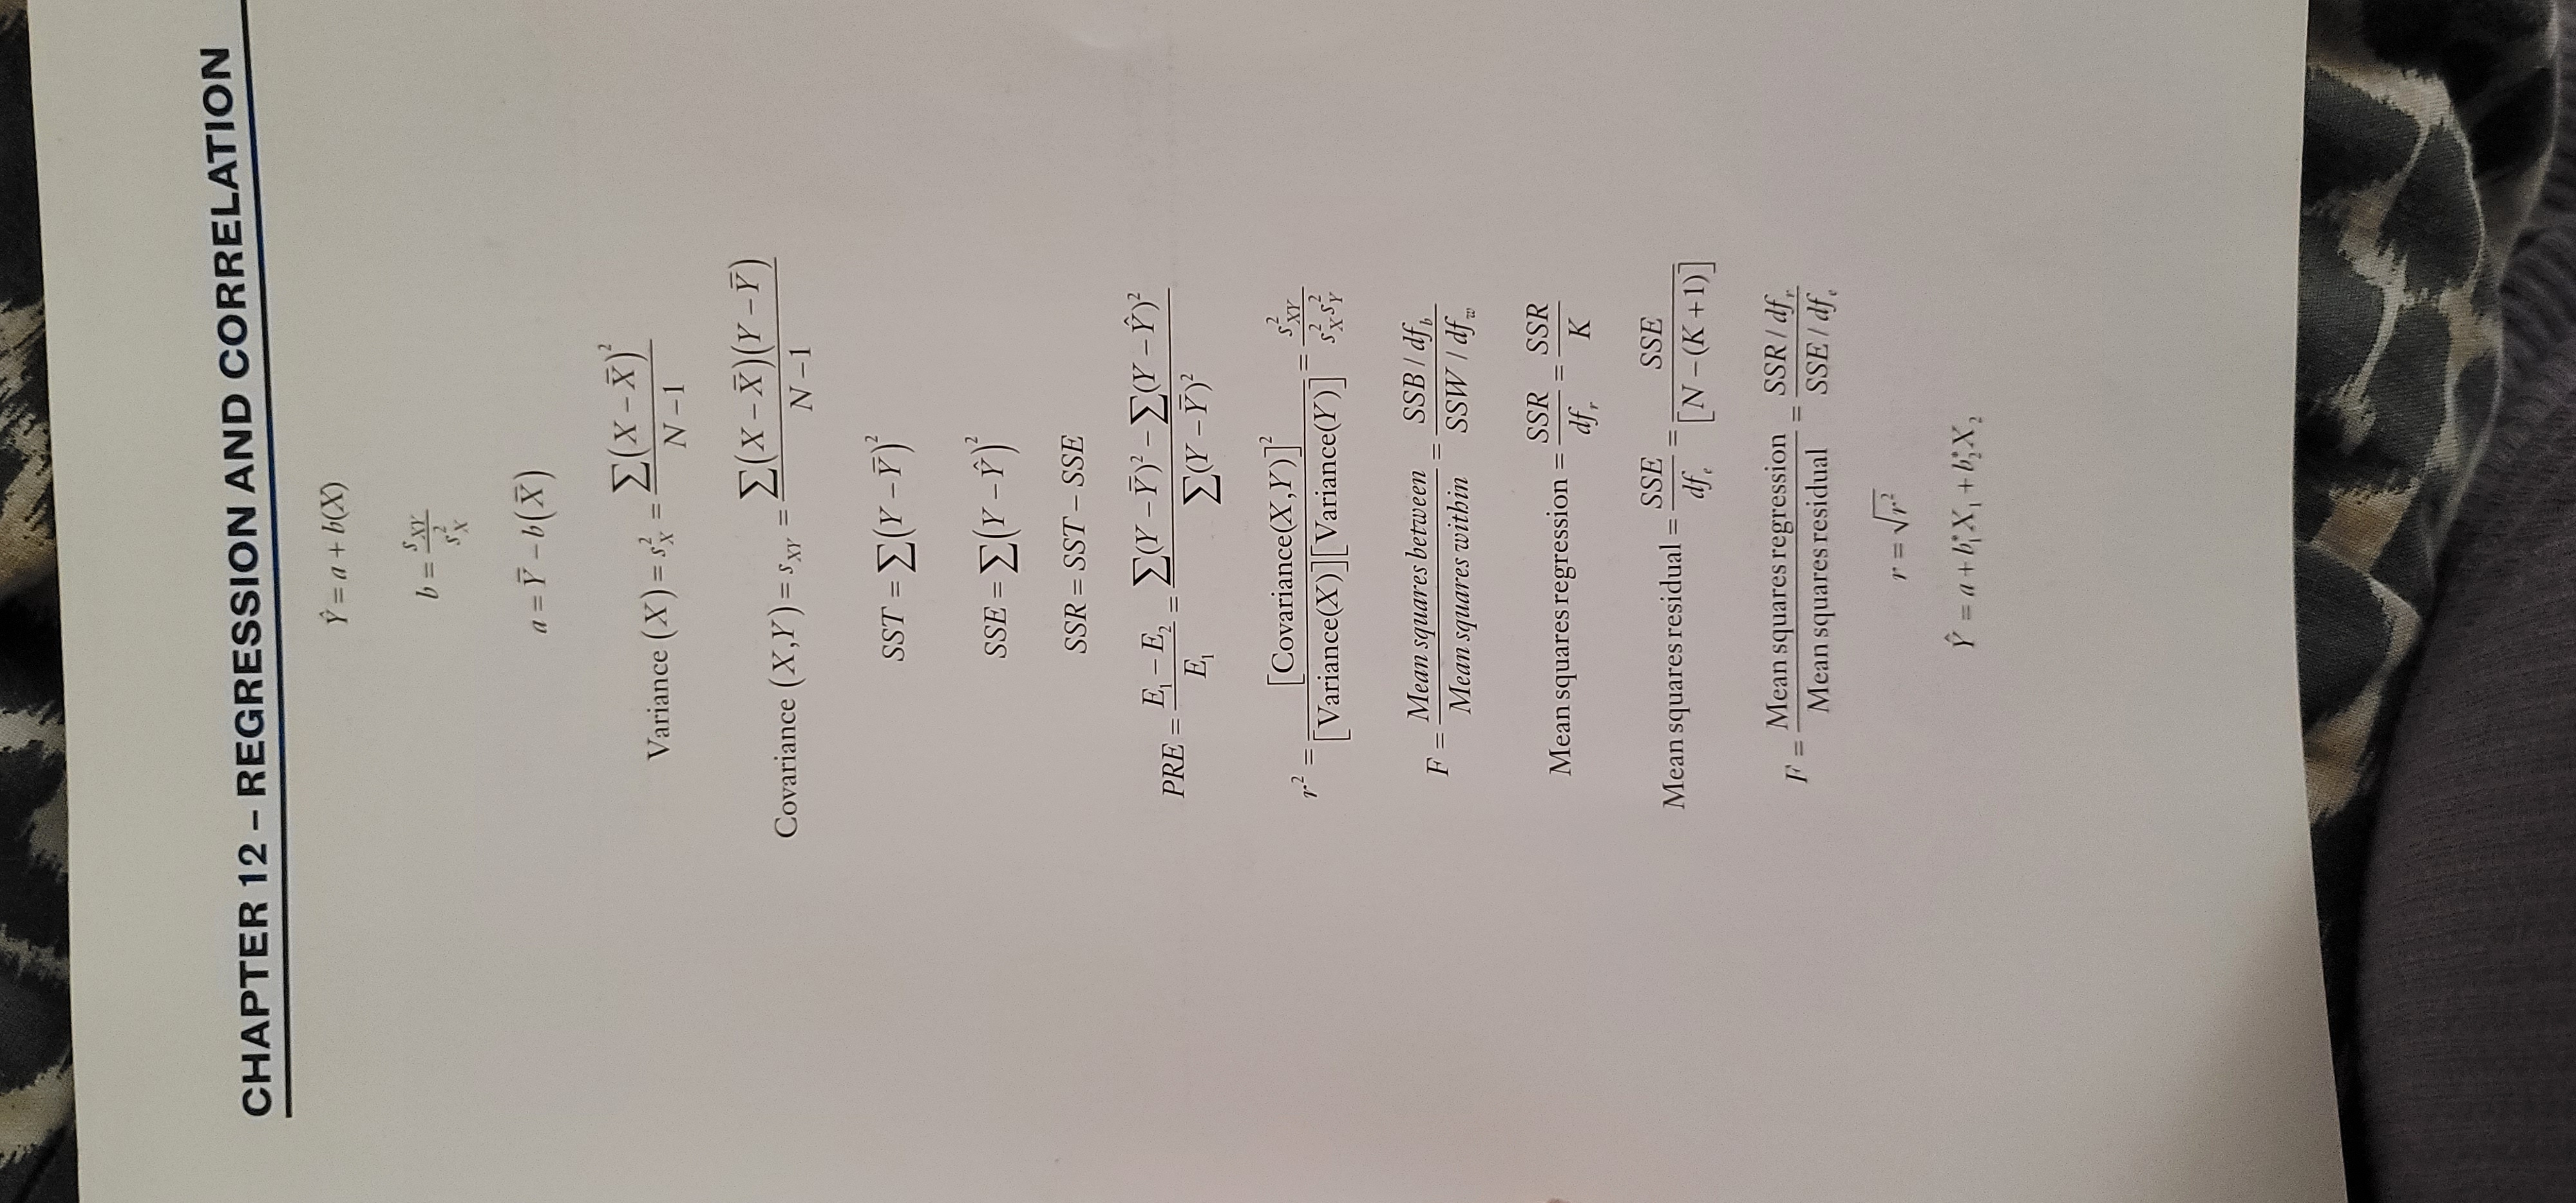
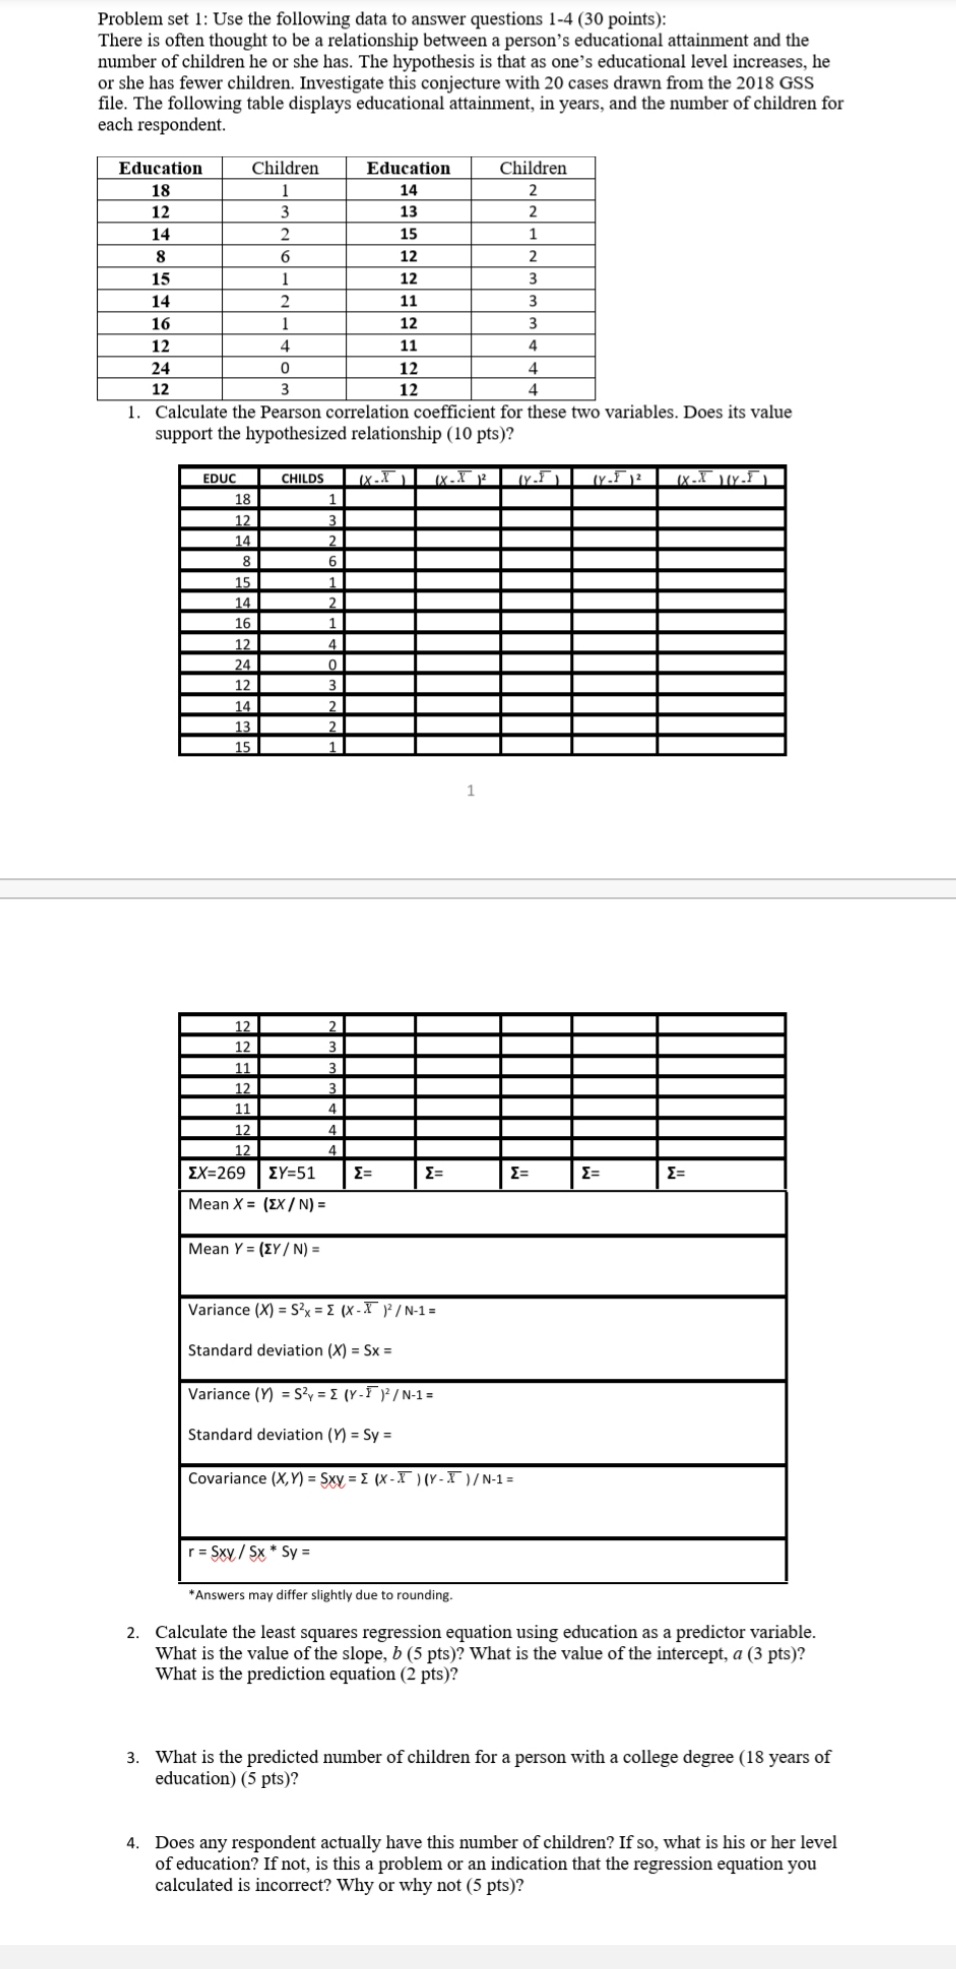
\fProblem set 1: Use the following data to answer questions [-4 (30 points): There is often thought to be a relationship between a person's educational attainment and the number of children he or she has. The hypothesis is that as one's educational level increases, he or she has fewer children. Investigate this conjecture with 20 cases drawn from the 2018 655 le. The following table displays educational attainment. in years, and the number of children for each respondent. 1. Calculate the Pearson correlation coefcient for these two variables. Does its value support the hypothesized relationship (10 pts)? Variancem =53x=t tx-T PIN-1- Standard deviation [X] = 5x = Variance (Y) = 52y = 1 {7.1711 I I\" - Standard deviation \"1 : 5y : Covariance MY} :51\": z (Jr-1' IlY-r HNi: r=5f'5v= 'Answers may dtffer slightly due to rounding 2. Calculate the least squares regression equation using education as a predictor variable. What is the value of the slope, b (5 pts)? What is the value of the intercept, a (3 pts)? What is the prediction equation (2 pts)? 3. What is the predicted number of children for a person with a college degree (18 years of education) (5 pts)? 4. Does any respondent actually have this number of children? If so, What is his or her level of education? Hoot, is this a problem or an indication that the regression equation you calculated is incorrect? Why or why not {5 pts)
Step by Step Solution
There are 3 Steps involved in it

Get step-by-step solutions from verified subject matter experts