

Question: Plot the calculated values (lines) on a P v diagram. On the same figure, plot the NIST data (points). Make sure that your plot
Plot the calculated values (lines) on a P − v diagram. On the same figure, plot the NIST data (points). Make sure that your plot captures the isotherms inside and outside of the vapor-liquid coexistence region.
Compare the accuracy of the calculated results and the NIST data. Evaluate the predictive accuracy of the VDW EoS and the PR EoS by calculating the relative (%) error select molar volumes for each isotherm calculated using both models. Present your calculated relative error values in a formatted table.
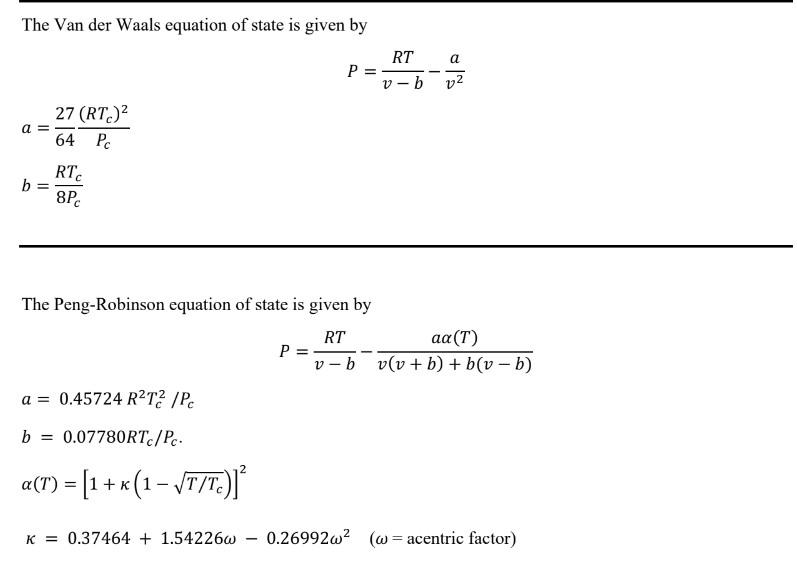
The Van der Waals equation of state is given by a = b = 27 (RTC) 64 Pc RTC 8Pc a = 0.45724 RT2/Pc b = 0.07780RTc/Pc. a(T) = [1 + x (1-T/Tc)]* K= 0.37464 +1.54226w P = P = RT v-b The Peng-Robinson equation of state is given by RT aa (T) v-b v(v +b) + b(v - b) - a v 0.26992w (w= acentric factor)
Step by Step Solution
There are 3 Steps involved in it
To compare the accuracy of the Van der Waals VDW and PengRobinson PR equations of state EoS with NIS... View full answer

Get step-by-step solutions from verified subject matter experts