

Question: Plot the experimental data on a p-h diagram (of R-22) to obtain the refrigeration cycle. 2.6.2 From the p-h-diagram, determine the enthalpy values and
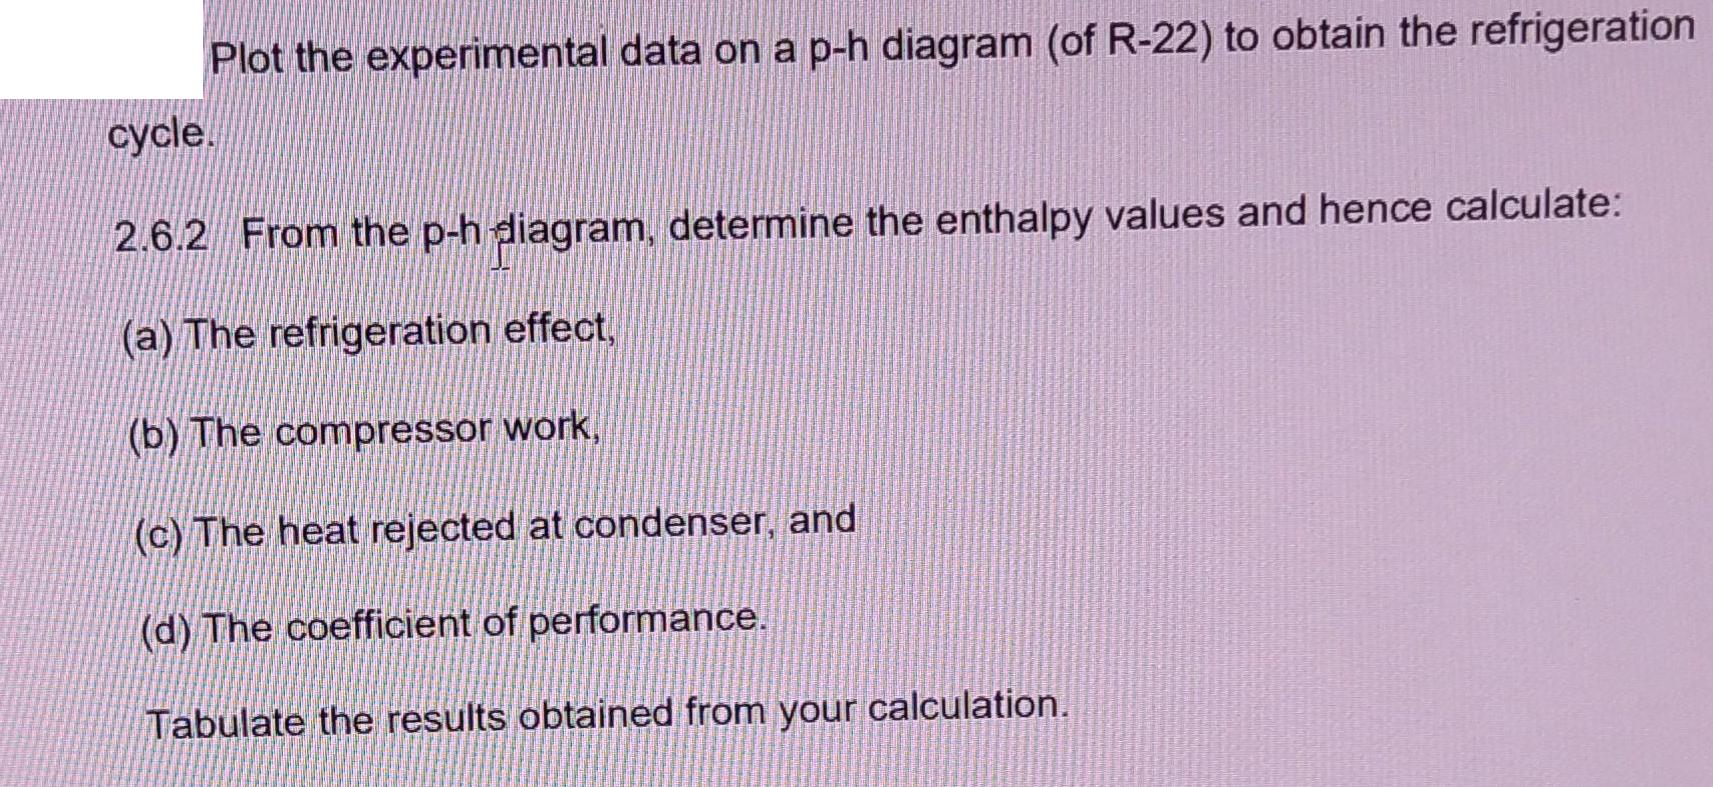
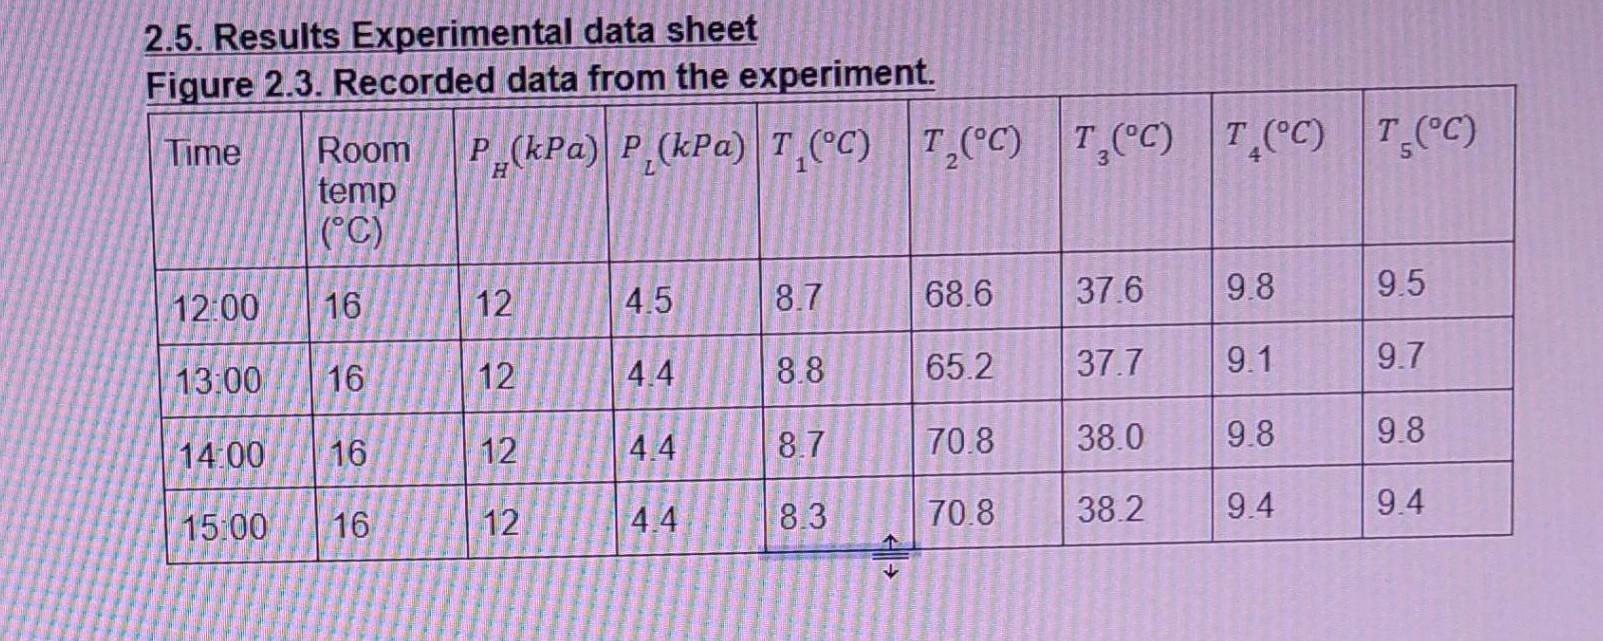
Plot the experimental data on a p-h diagram (of R-22) to obtain the refrigeration cycle. 2.6.2 From the p-h-diagram, determine the enthalpy values and hence calculate: (a) The refrigeration effect, (b) The compressor work, (c) The heat rejected at condenser, and (d) The coefficient of performance. Tabulate the results obtained from your calculation. 2.5. Results Experimental data sheet Figure 2.3. Recorded data from the experiment. Time Room P_(kPa) P (kPa) T (C) T,(C) T,(C) T(C) T (C) H temp (C) 16 16 12:00 13:00 14:00 15:00 16 16 12 12 12 12 4.5 4.4 4.4 4.4 8.7 8.8 8.7 8.3 68.6 65.2 70.8 70.8 37.6 37.7 38.0 38.2 9.8 9.1 9.8 9.4 9.5 9.7 9.8 9.4
Step by Step Solution
3.48 Rating (161 Votes )
There are 3 Steps involved in it

Get step-by-step solutions from verified subject matter experts