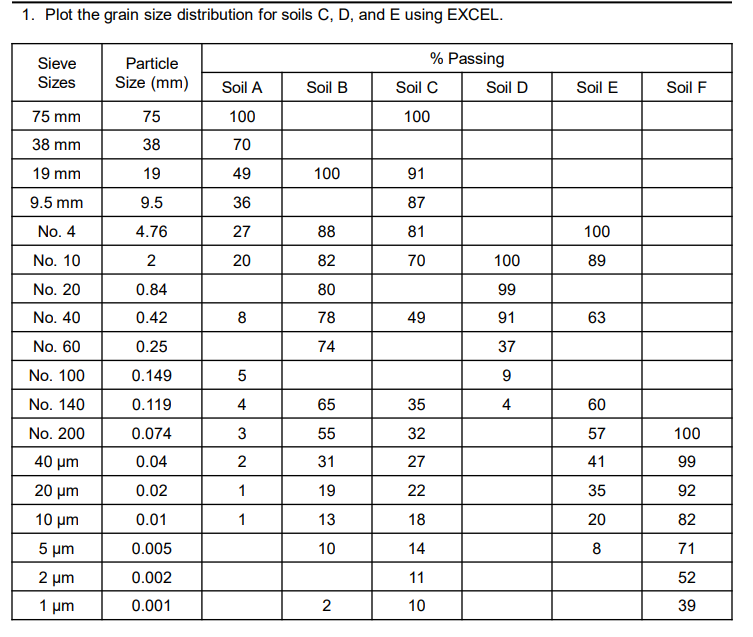
Question: Plot the grain size distribution for soils C , D , and E using EXCEL. table [ [ table [ [ Sieve ]

Plot the grain size distribution for soils C,D, and E using EXCEL.
\table[[\table[[Sieve],[Sizes]],\table[[Particle],[Size (mm)]],% Passing,],[Soil A,Soil B,Soil C,Soil D,Soil E,Soil F],[75 mm,75,100,,100,,,],[38 mm,38,70,,,,,],[19 mm,19,49,100,91,,,],[9.5 mm,9.5,36,,87,,,],[No.4,4.76,27,88,81,,100,],[No.10,2,20,82,70,100,89,],[No.20,0.84,,80,,99,,],[No.40,0.42,8,78,49,91,63,],[No.60,0.25,,74,,37,,],[No.100,0.149,5,,,9,,],[No.140,0.119,4,65,35,4,60,],[No.200,0.074,3,55,32,,57,100],[40\mu m,0.04,2,31,27,,41,99],[20\mu m,0.02,1,19,22,,35,92],[10\mu m,0.01,1,13,18,,20,82],[5\mu m,0.005,,10,14,,8,71],[2\mu m,0.002,,,11,,,52],[1\mu m,0.001,,2,10,,,39]]
Plot the grain size distribution for soils C , D

Step by Step Solution

There are 3 Steps involved in it

1 Expert Approved Answer
Step: 1 Unlock blur-text-image
Question Has Been Solved by an Expert!

Get step-by-step solutions from verified subject matter experts

Step: 2 Unlock
Step: 3 Unlock

Students Have Also Explored These Related Civil Engineering Questions!