

Question: Plotting trigonometric functions Note: Along with this assignment, you will find a file, named xd.dat. You have to use this file for your plots. (As
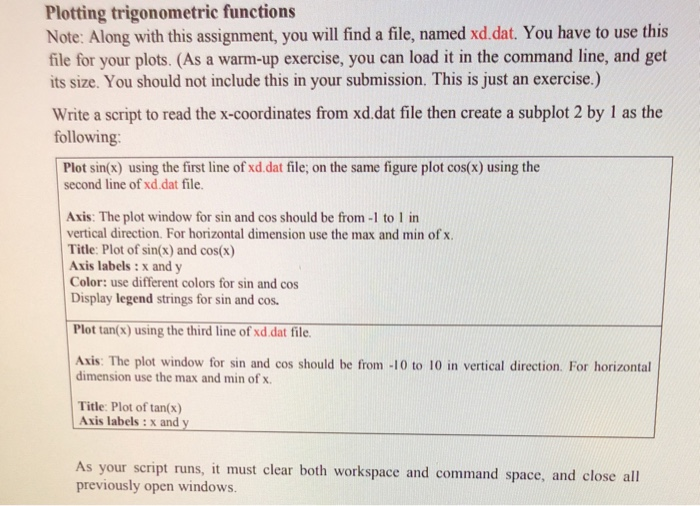
Plotting trigonometric functions Note: Along with this assignment, you will find a file, named xd.dat. You have to use this file for your plots. (As a warm-up exercise, you can load it in the command line, and get its size. You should not include this in your submission. This is just an exercise.) Write a script to read the x-coordinates from xd dat file then create a subplot 2 by 1 as the following: Plot sin(x) using the first line of xd.dat file; on the same figure plot cos(x) using the second line of xd.dat file Axis: The plot window for sin and cos should be from -1 to 1 in vertical direction. For horizontal dimension use the max and min of x Title: Plot of sin(x) and cos(x) Axis labels : x and y Color: use different colors for sin and cos Display legend strings for sin and cos Plot tan(x) using the third line of xd.dat file. Axis: The plot window for sin and cos should be from -10 to 10 in vertical direction. For horizontal dimension use the max and min of x Title:Plot of tan(x) Axis labels:x and y your script runs, it must clear both workspace and command space, and close all previously open windows. Plotting trigonometric functions Note: Along with this assignment, you will find a file, named xd.dat. You have to use this file for your plots. (As a warm-up exercise, you can load it in the command line, and get its size. You should not include this in your submission. This is just an exercise.) Write a script to read the x-coordinates from xd dat file then create a subplot 2 by 1 as the following: Plot sin(x) using the first line of xd.dat file; on the same figure plot cos(x) using the second line of xd.dat file Axis: The plot window for sin and cos should be from -1 to 1 in vertical direction. For horizontal dimension use the max and min of x Title: Plot of sin(x) and cos(x) Axis labels : x and y Color: use different colors for sin and cos Display legend strings for sin and cos Plot tan(x) using the third line of xd.dat file. Axis: The plot window for sin and cos should be from -10 to 10 in vertical direction. For horizontal dimension use the max and min of x Title:Plot of tan(x) Axis labels:x and y your script runs, it must clear both workspace and command space, and close all previously open windows
Step by Step Solution
There are 3 Steps involved in it

Get step-by-step solutions from verified subject matter experts