

Question: pls help i will like 3 Refer to Tabit Seit. Factors foc Computing Control Chart Limits i2 sigma) for this problem Thiryefive samples of nue
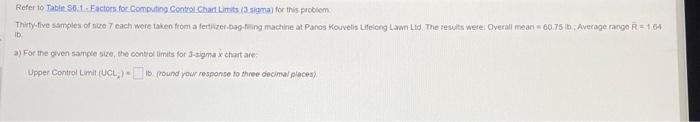
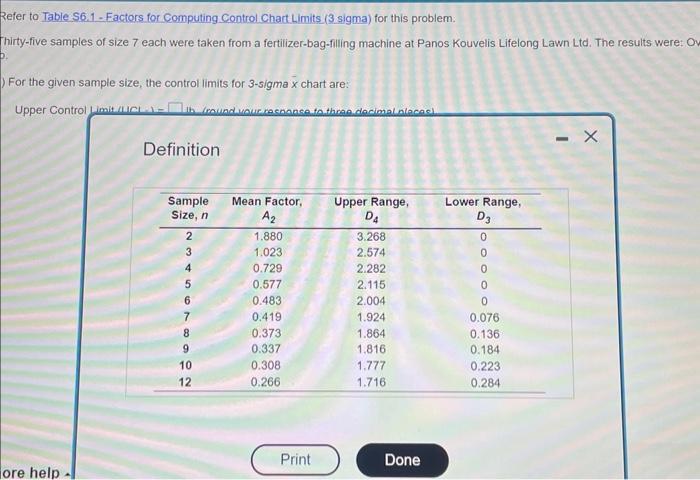
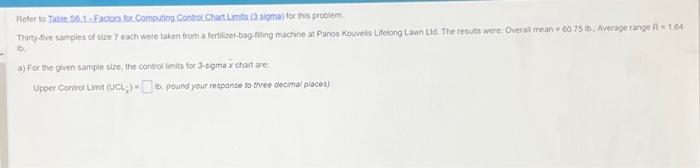
Refer to Tabit Seit. Factors foc Computing Control Chart Limits i2 sigma) for this problem Thiryefive samples of nue 7 each were taken from a ferticter.bag.fing machine at Panos Kouvelis Lifiong Lawn Lid, The results were. Overall mean a 60.75 ib, Average mange R=164 Ib a) For the given sample size, the control timits for J-tigna x chart are: Upper Control Limit (UCL;)= 16. round your response to three decimal places) Refer to Table S6.1 - Factors for Computing Control Chart Limits (3 sigma) for this problem: Chirty-five samples of size 7 each were taken from a fertilizer-bag-filling machine at Panos Kouvelis Lifelong Lawn Ltd. The results were: For the given sample size, the control limits for 3 -sigma x chart are: Definition Reser to Tabie S6.1. Eactocs for Compritipg Control Chart Limts i3 sigma) for this problem a) For the given sarpie size, the contol imits for 3-sigme x chart are Upper Control LimA (UCL;) = 16. (round your respanse to three decimal places)
Step by Step Solution
There are 3 Steps involved in it

Get step-by-step solutions from verified subject matter experts