

Question: Previous answer posted had the wrong output, the math was incorrect. Here is the question again. Please test with this sample output. 5.11 LAB: Confidence
Previous answer posted had the wrong output, the math was incorrect. Here is the question again.
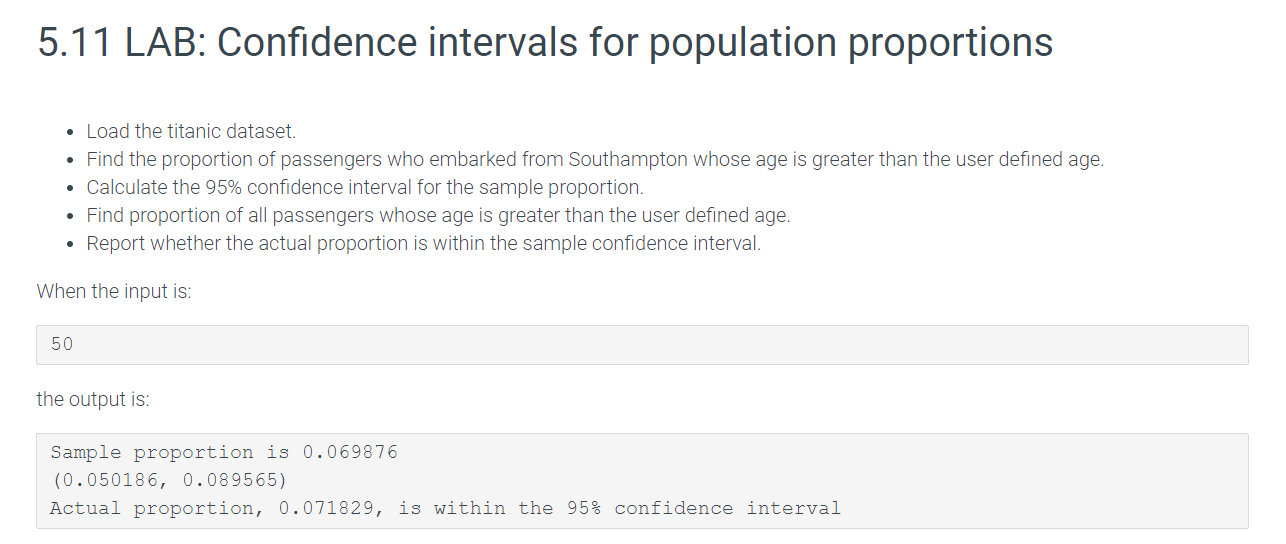 Please test with this sample output.
5.11 LAB: Confidence intervals for population proportions - Load the titanic dataset. - Find the proportion of passengers who embarked from Southampton whose age is greater than the user defined age. - Calculate the 95% confidence interval for the sample proportion. - Find proportion of all passengers whose age is greater than the user defined age. - Report whether the actual proportion is within the sample confidence interval
Step by Step Solution
There are 3 Steps involved in it
1 Expert Approved Answer
Step: 1 Unlock

Question Has Been Solved by an Expert!
Get step-by-step solutions from verified subject matter experts
Step: 2 Unlock
Step: 3 Unlock