

Question: Problem 1 ( 2 5 % ) A block diagram is shown in Fig. 1 . ( a ) When r ( t ) is
Problem
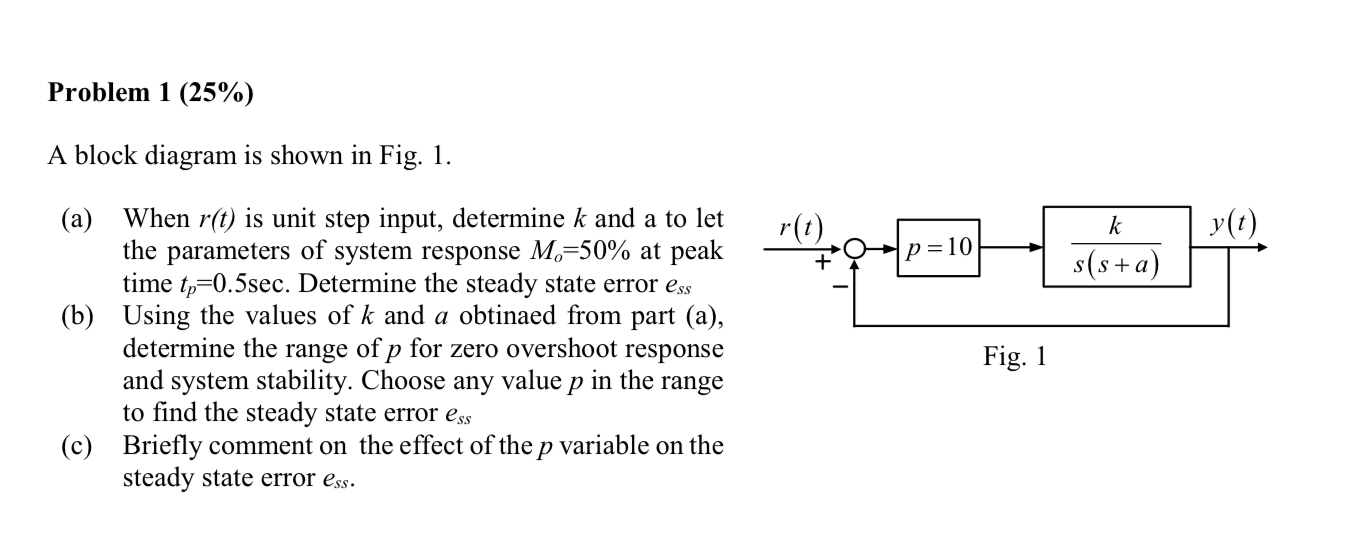
A block diagram is shown in Fig.
a When is unit step input, determine and a to let the parameters of system response at peak time Determine the steady state error
b Using the values of and a obtinaed from part a determine the range of for zero overshoot response and system stability. Choose any value in the range to find the steady state error
c Briefly comment on the effect of the variable on the steady state error
Step by Step Solution
There are 3 Steps involved in it
1 Expert Approved Answer
Step: 1 Unlock

Question Has Been Solved by an Expert!
Get step-by-step solutions from verified subject matter experts
Step: 2 Unlock
Step: 3 Unlock