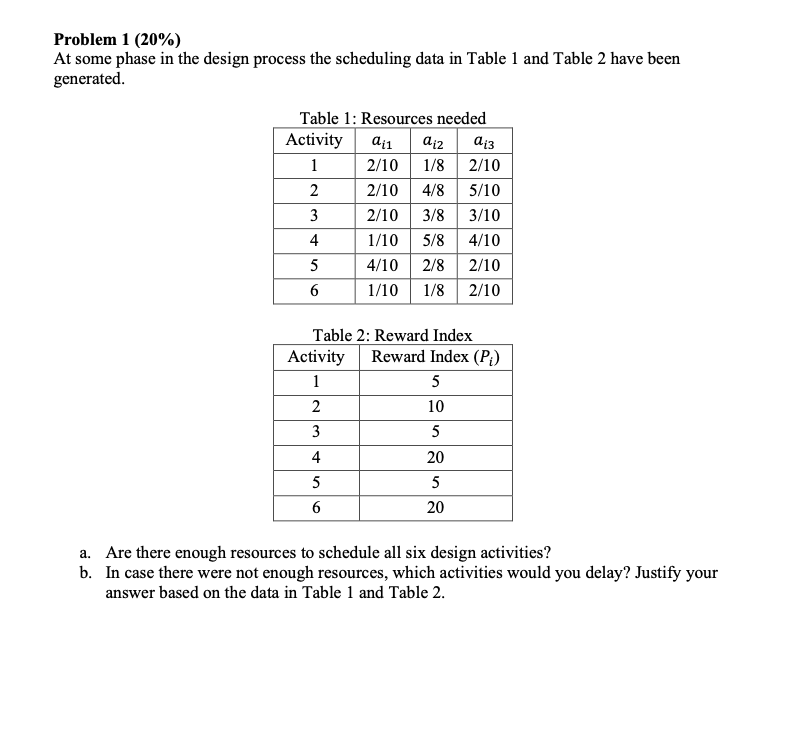
Question: Problem 1 (20%) At some phase in the design process the scheduling data in Table 1 and Table 2 have been generated. Table 1: Resources

Problem 1 (20%) At some phase in the design

Problem 1 (20%) At some phase in the design process the scheduling data in Table 1 and Table 2 have been generated. Table 1: Resources needed Activity ai1 aiz ai 1 2/10 1/8 2/10 2 2/10 4/8 5/10 3 2/10 3/8 3/10 4 1/10 5/8 4/10 5 4/10 2/8 2/10 6 1/10 1/8 2/10 Table 2: Reward Index Activity Reward Index (P:) 1 5 2 10 3 5 4 20 5 5 6 20 a. Are there enough resources to schedule all six design activities? b. In case there were not enough resources, which activities would you delay? Justify your answer based on the data in Table 1 and Table 2. Problem 1 (20%) At some phase in the design process the scheduling data in Table 1 and Table 2 have been generated. Table 1: Resources needed Activity ai1 aiz ai 1 2/10 1/8 2/10 2 2/10 4/8 5/10 3 2/10 3/8 3/10 4 1/10 5/8 4/10 5 4/10 2/8 2/10 6 1/10 1/8 2/10 Table 2: Reward Index Activity Reward Index (P:) 1 5 2 10 3 5 4 20 5 5 6 20 a. Are there enough resources to schedule all six design activities? b. In case there were not enough resources, which activities would you delay? Justify your answer based on the data in Table 1 and Table 2

Step by Step Solution

There are 3 Steps involved in it

1 Expert Approved Answer
Step: 1 Unlock blur-text-image
Question Has Been Solved by an Expert!

Get step-by-step solutions from verified subject matter experts

Step: 2 Unlock
Step: 3 Unlock

Students Have Also Explored These Related General Management Questions!