

Question: Problem 1 (20 points) The prob1data.txt file contains data collected from an experiment. The first column of the data in this file is the
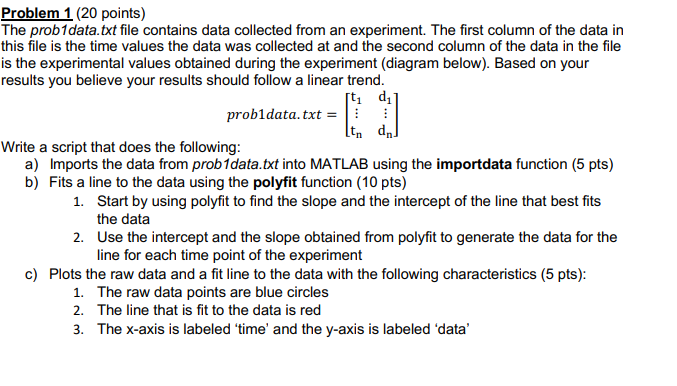
Problem 1 (20 points) The prob1data.txt file contains data collected from an experiment. The first column of the data in this file is the time values the data was collected at and the second column of the data in the file is the experimental values obtained during the experiment (diagram below). Based on your results you believe your results should follow a linear trend. [t d] probldata.txt=|| [tn Write a script that does the following: a) Imports the data from prob1data.txt into MATLAB using the importdata function (5 pts) b) Fits a line to the data using the polyfit function (10 pts) 1. Start by using polyfit to find the slope and the intercept of the line that best fits the data 2. Use the intercept and the slope obtained from polyfit to generate the data for the line for each time point of the experiment c) Plots the raw data and a fit line to the data with the following characteristics (5 pts): 1. The raw data points are blue circles 2. The line that is fit to the data is red 3. The x-axis is labeled 'time' and the y-axis is labeled 'data'
Step by Step Solution
3.31 Rating (157 Votes )
There are 3 Steps involved in it
To handle this problem we would need to create a MATLAB script following each of the tasks a through ... View full answer

Get step-by-step solutions from verified subject matter experts