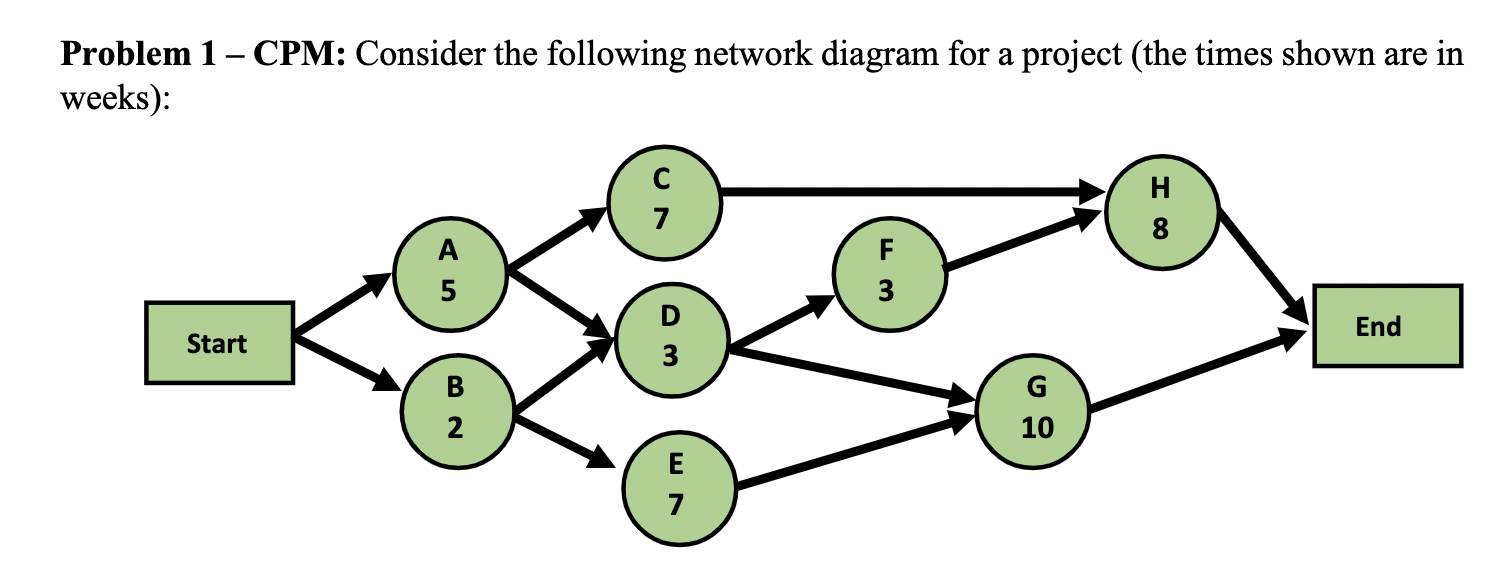
Question: - Problem 1 - CPM: Consider the following network diagram for a project (the times shown are in weeks): H 8 A F 3 End

- Problem 1 - CPM: Consider the following network

- Problem 1 - CPM: Consider the following network

- Problem 1 - CPM: Consider the following network diagram for a project (the times shown are in weeks): H 8 A F 3 End Start 3 B 2 G 10 E N 7 - Problem 2 - PERT: Consider the same project from Problem 1 (i.e., the network diagram should look identical) The network diagram above is based on the most likely duration time for each activity. The table below now provides additional information regarding the optimistic and pessimistic duration times. Immediate Predecessors Activity A B D E F G H A A, B B D D, E C, F Weeks Required Optimistic Most Likely Pessimistic 4 5 6 1 2 3 4 7 10 1 3 5 6 7 8 2 3 4 7 10 13 6 8 10 (a) Determine the expected project completion time and the variance. (b) Find the probability that the project will take 21 weeks or more

Step by Step Solution

There are 3 Steps involved in it

1 Expert Approved Answer
Step: 1 Unlock blur-text-image
Question Has Been Solved by an Expert!

Get step-by-step solutions from verified subject matter experts

Step: 2 Unlock
Step: 3 Unlock

Students Have Also Explored These Related General Management Questions!