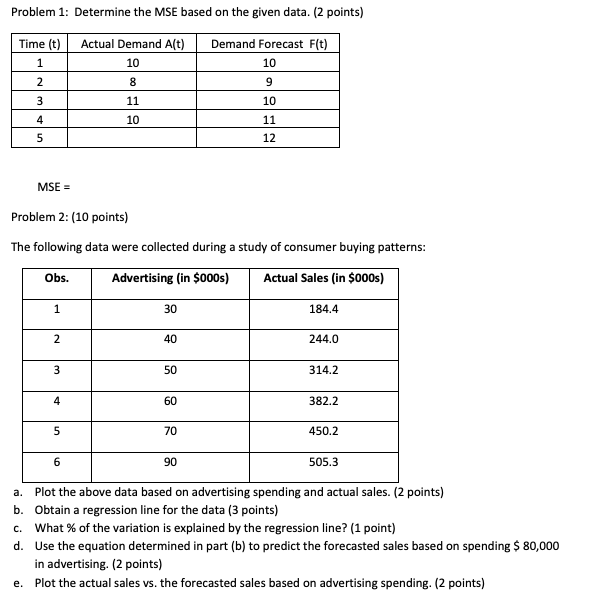
Question: Problem 1: Determine the MSE based on the given data. (2 points) Time (t) 1 Actual Demand Alt) 10 Demand Forecast F(t) 10 2 8

Problem 1: Determine the MSE based on the given

Problem 1: Determine the MSE based on the given data. (2 points) Time (t) 1 Actual Demand Alt) 10 Demand Forecast F(t) 10 2 8 9 3 11 10 10 4 5 11 12 MSE = Problem 2: (10 points) The following data were collected during a study of consumer buying patterns: Obs. Advertising (in $000s) Actual Sales (in $000s) 1 30 184.4 2 40 244.0 3 50 314.2 4 60 382.2 5 70 450.2 6 90 505.3 a. Plot the above data based on advertising spending and actual sales. (2 points) b. Obtain a regression line for the data (3 points) c. What % of the variation is explained by the regression line? (1 point) d. Use the equation determined in part (b) to predict the forecasted sales based on spending $ 80,000 in advertising. (2 points) Plot the actual sales vs. the forecasted sales based on advertising spending. (2 points) e

Step by Step Solution

There are 3 Steps involved in it

1 Expert Approved Answer
Step: 1 Unlock blur-text-image
Question Has Been Solved by an Expert!

Get step-by-step solutions from verified subject matter experts

Step: 2 Unlock
Step: 3 Unlock

Students Have Also Explored These Related General Management Questions!