

Question: Problem #1: The table below provides the estimated end-of-year net cash flows that would be received from alternative projects Red and Blue for an investment
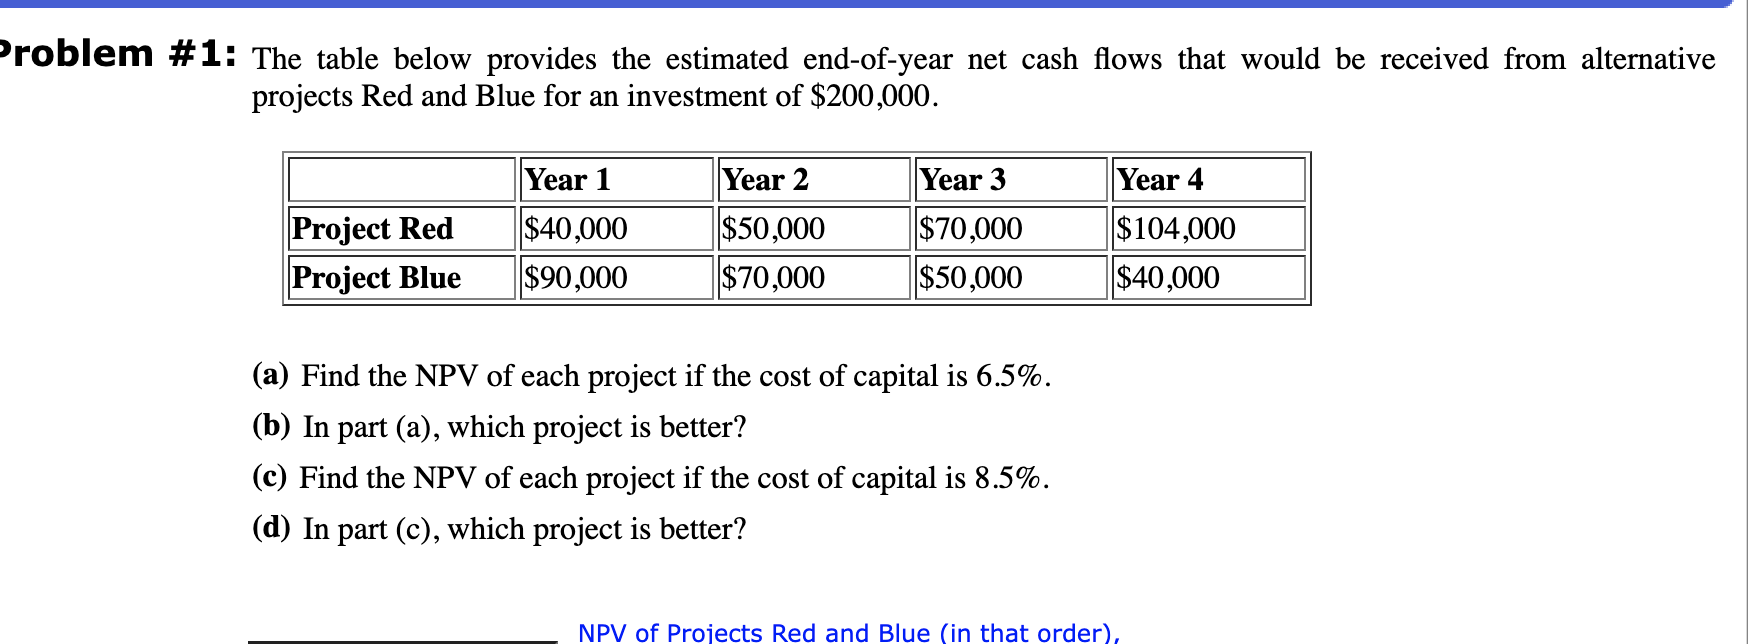
Problem #1: The table below provides the estimated end-of-year net cash flows that would be received from alternative projects Red and Blue for an investment of $200,000. Year 1 Year 2 Year 3 Year 4 Project Red Project Blue ||$40,000 $90,000 $50,000 $70,000 |$70,000 $50,000 ||$104,000 ||$40,000 (a) Find the NPV of each project if the cost of capital is 6.5%. (b) In part (a), which project is better? (c) Find the NPV of each project if the cost of capital is 8.5%. (d) In part (c), which project is better? NPV of Projects Red and Blue (in that order)
Step by Step Solution
There are 3 Steps involved in it
1 Expert Approved Answer
Step: 1 Unlock

Question Has Been Solved by an Expert!
Get step-by-step solutions from verified subject matter experts
Step: 2 Unlock
Step: 3 Unlock