

Question: Problem #1: The table below provides the estimated end-of-year net cash flows that would be received from alternative projects Red and Blue for an investment
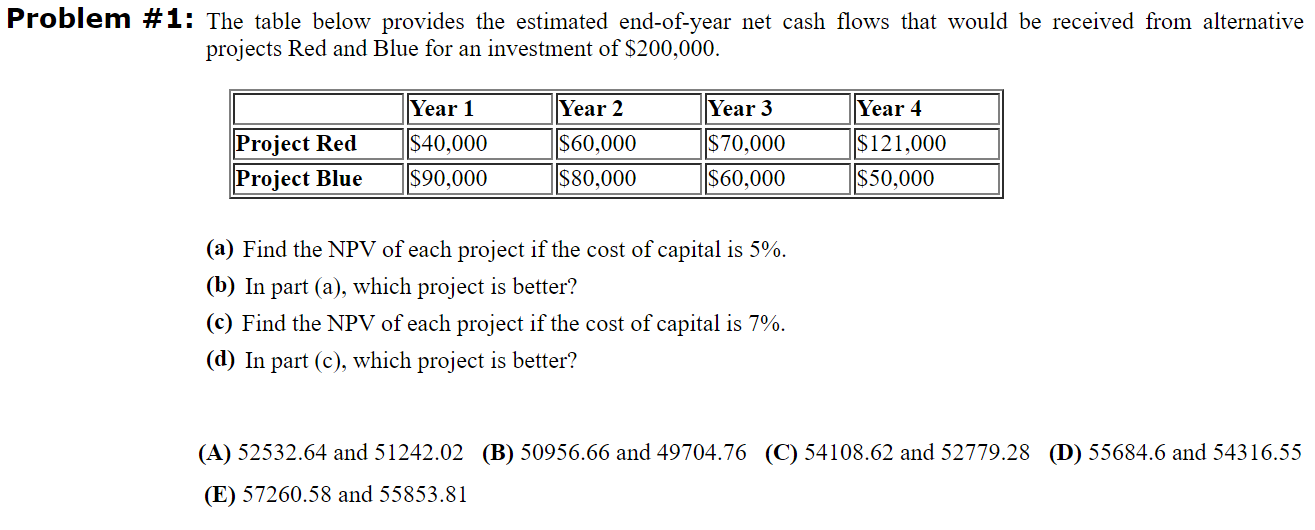
Problem #1: The table below provides the estimated end-of-year net cash flows that would be received from alternative projects Red and Blue for an investment of $200,000. Project Red Project Blue Year 1 $40,000 $90,000 Year 2 $60,000 $80,000 Year 3 ||$70,000 $60,000 Year 4 $121,000 $50,000 (a) Find the NPV of each project if the cost of capital is 5%. (b) In part (a), which project is better? (c) Find the NPV of each project if the cost of capital is 7%. (d) In part (c), which project is better? (A) 52532.64 and 51242.02 (B) 50956.66 and 49704.76 (C) 54108.62 and 52779.28 (D) 55684.6 and 54316.55 (E) 57260.58 and 55853.81
Step by Step Solution
There are 3 Steps involved in it
1 Expert Approved Answer
Step: 1 Unlock

Question Has Been Solved by an Expert!
Get step-by-step solutions from verified subject matter experts
Step: 2 Unlock
Step: 3 Unlock