

Question: Problem #1: The table below provides the estimated end-of-year net cash flows that would be received from alternative projects Red and Blue for an investment
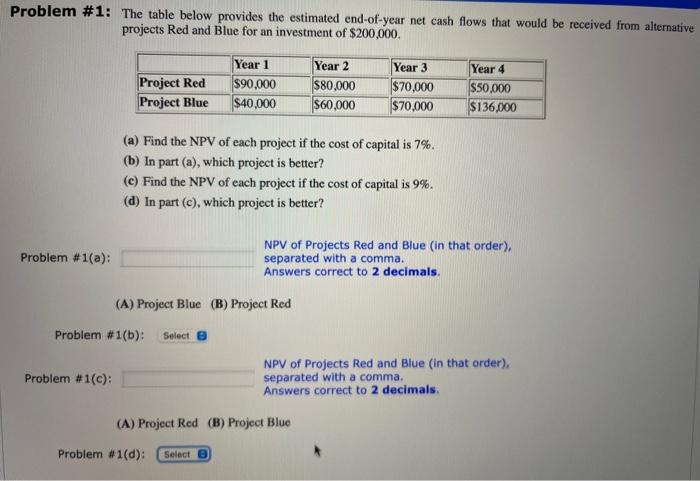
Problem #1: The table below provides the estimated end-of-year net cash flows that would be received from alternative projects Red and Blue for an investment of $200,000. Year 3 Project Red Project Blue Year 1 $90,000 $40,000 Year 2 $80,000 $60,000 $70,000 $70,000 Year 4 $50,000 $136,000 (a) Find the NPV of each project if the cost of capital is 7%. (b) In part (a), which project is better? (e) Find the NPV of each project if the cost of capital is 9%. (d) In part (e), which project is better? Problem #1(a): NPV of Projects Red and Blue (in that order), separated with a comma. Answers correct to 2 decimals. (A) Project Blue (B) Project Red Problem #1(b): Select Problem #1(c): NPV of Projects Red and Blue (in that order), separated with a comma. Answers correct to 2 decimals. (A) Project Red (B) Project Blue Problem #1(d): Select
Step by Step Solution
There are 3 Steps involved in it

Get step-by-step solutions from verified subject matter experts