

Question: Problem #1: The table below provides the estimated end-of-year net cash flows that would be received from alternative projects Red and Blue for an investment
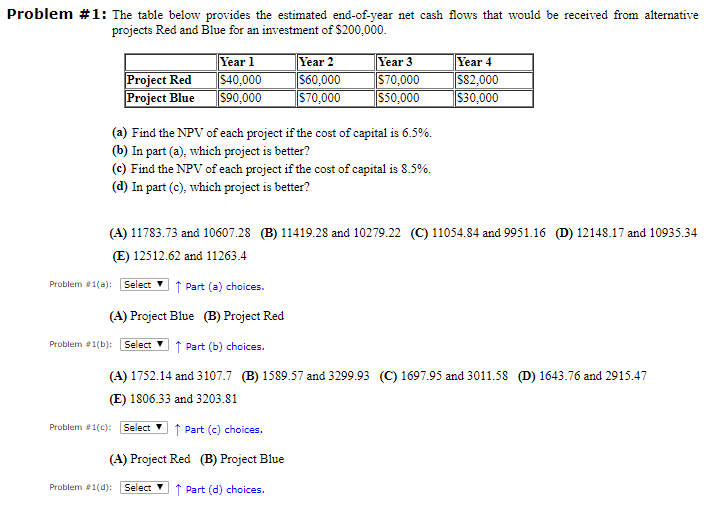
Problem #1: The table below provides the estimated end-of-year net cash flows that would be received from alternative projects Red and Blue for an investment of $200,000. Project Red Project Blue Year 1 $40,000 $90,000 Year 2 $60,000 $70,000 Year 3 S70,000 $50,000 Year 4 $82,000 $30,000 (a) Find the NPV of each project if the cost of capital is 6.5%. (b) In part (a), which project is better? (c) Find the NPV of each project if the cost of capital is 8.5%. (d) In part (c), which project is better? (A) 11783.73 and 10607.28 (B) 11419.28 and 10279.22 (C) 11054.84 and 9951.16 (D) 12148.17 and 10935.34 (E) 12512.62 and 11263.4 Problem #1(a): Select Part (a) choices. (A) Project Blue (B) Project Red Problem #1(b): Select t Part (b) choices. (A) 1752.14 and 3107.7 (B) 1589.57 and 3299.93 (C) 1697.95 and 3011.58 (D) 1643.76 and 2915.47 (E) 1806.33 and 3203.81 Problem #1(c): Select Part (c) choices. (A) Project Red (B) Project Blue Problem #1(d): Select t Part (d) choices
Step by Step Solution
There are 3 Steps involved in it

Get step-by-step solutions from verified subject matter experts