

Question: Problem 10-4 (Static) Software upgrade times (in minutes) are being evaluated. Samples of five observations each have been taken, and the results are as
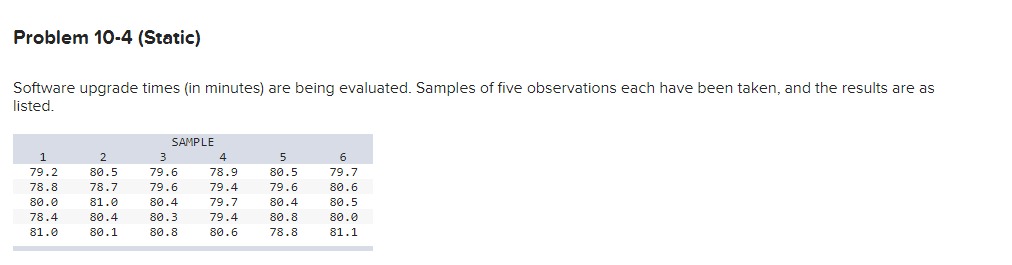
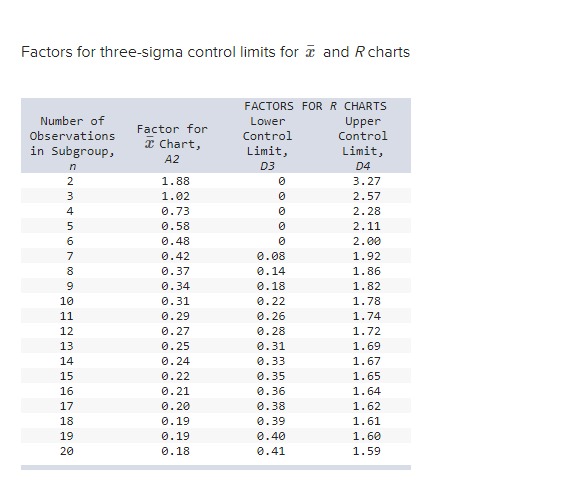
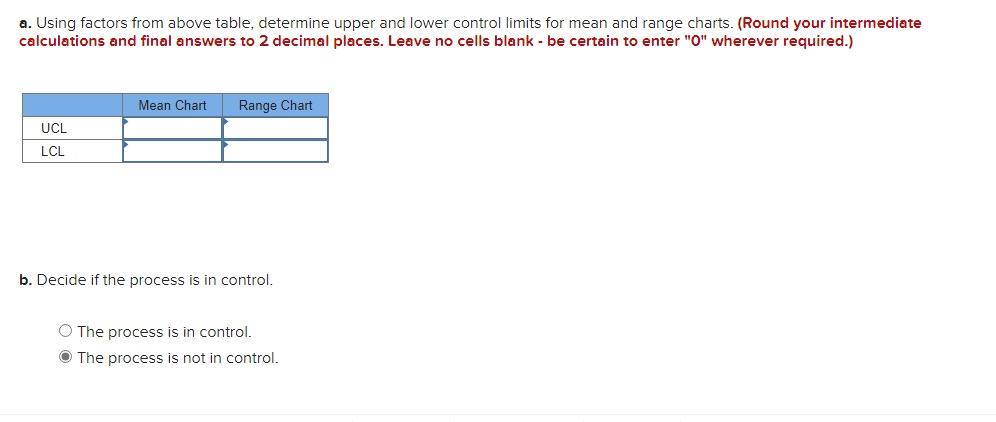
Problem 10-4 (Static) Software upgrade times (in minutes) are being evaluated. Samples of five observations each have been taken, and the results are as listed. SAMPLE 1 2 3 4 5 6 79.2 80.5 79.6 78.9 80.5 79.7 78.8 78.7 79.6 79.4 79.6 80.6 80.0 81.0 80.4 79.7 80.4 80.5 78.4 80.4 80.3 79.4 80.8 80.0 81.0 80.1 80.8 80.6 78.8 81.1 Factors for three-sigma control limits for and R charts FACTORS FOR R CHARTS Number of Lower Upper Factor for Observations Control Control Chart, in Subgroup, Limit, Limit, A2 n D3 D4 10 14 234567 BROWNEL 1.88 0 3.27 1.02 0 2.57 0.73 0 2.28 0.58 0 2.11 0.48 0 2.00 0.42 0.08 1.92 8 0.37 0.14 1.86 9 0.34 0.18 1.82 0.31 0.22 1.78 11 0.29 0.26 1.74 12 0.27 0.28 1.72 13 0.25 0.31 1.69 0.24 0.33 1.67 15 0.22 0.35 1.65 16 0.21 0.36 1.64 17 0.20 0.38 1.62 18 0.19 0.39 1.61 19 0.19 0.40 1.60 20 0.18 0.41 1.59 a. Using factors from above table, determine upper and lower control limits for mean and range charts. (Round your intermediate calculations and final answers to 2 decimal places. Leave no cells blank - be certain to enter "0" wherever required.) Mean Chart Range Chart UCL LCL b. Decide if the process is in control. The process is in control. The process is not in control.
Step by Step Solution
There are 3 Steps involved in it

Get step-by-step solutions from verified subject matter experts