

Question: The data in the table below, represent individual observations on molecular weight taken hourly from a chemical process. The target value of molecular weight is
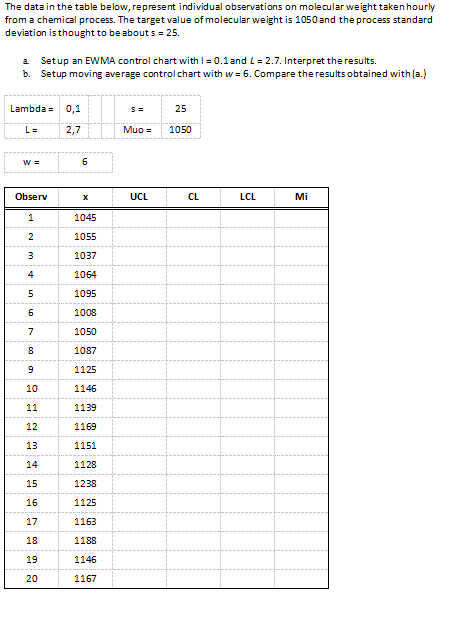
The data in the table below, represent individual observations on molecular weight taken hourly from a chemical process. The target value of molecular weight is 1050 and the process standard deviation is thought to be about s=25. a. Setup an EWMA control chart with I=0.1 and L=2.7. Interpret the results. b. Setup moving average control chart with w=6. Compare the results obtained with (a.)
Step by Step Solution
There are 3 Steps involved in it
1 Expert Approved Answer
Step: 1 Unlock

Question Has Been Solved by an Expert!
Get step-by-step solutions from verified subject matter experts
Step: 2 Unlock
Step: 3 Unlock