

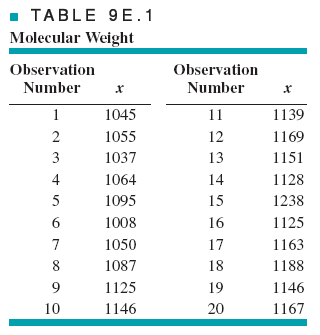
Question: The data in Table 9E.1 represent individual observations on molecular weight taken hourly from a chemical process. The target value of molecular weight is 1050
The data in Table 9E.1 represent individual observations on molecular weight taken hourly from a chemical process. The target value of molecular weight is 1050 and the process standard deviation is thought to be about ? = 25.
(a) Set up a tabular cusum for the mean of this process. Design the cusum to quickly detect a shift of
about 1.0 ? in the process mean.
(b) Also add a headstart feature to the cusum
\f
Step by Step Solution
There are 3 Steps involved in it
1 Expert Approved Answer
Step: 1 Unlock

Question Has Been Solved by an Expert!
Get step-by-step solutions from verified subject matter experts
Step: 2 Unlock
Step: 3 Unlock