

Question: Problem 4: Please answer the following questions a) In the below diagram, seven rule run for software virs inspection in different months are provided. In
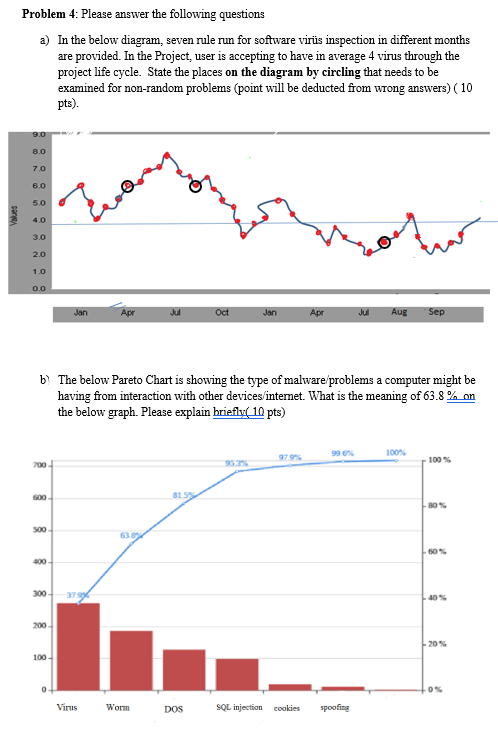
Problem 4: Please answer the following questions a) In the below diagram, seven rule run for software virs inspection in different months are provided. In the Project, user is accepting to have in average 4 virus through the project life cycle. State the places on the diagram by circling that needs to be examined for non-random problems (point will be deducted from wrong answers) ( 10 pts). 9.0 8.0 70 60 50 Teol Values 4.0 3.0 20 1.0 0.0 Jan Apr Jul Oct Jan Apr Ju Aug Sep b) The below Pareto Chart is showing the type of malware problems a computer might be having from interaction with other devices/intemet. What is the meaning of 63.8% on the below graph. Please explain briefly( 10 pts) 996 100% 700 952 100% 31.5 500 400 300 379 200 20% 100 0 Virus Worm DOS SQL injection cookies spoofing
Step by Step Solution
There are 3 Steps involved in it

Get step-by-step solutions from verified subject matter experts