

Question: Problem 4 : ( Points 1 0 ) Draw the Range Specification Graph for the 6 4 - bit double precision floating point numbers. The
Problem : Points
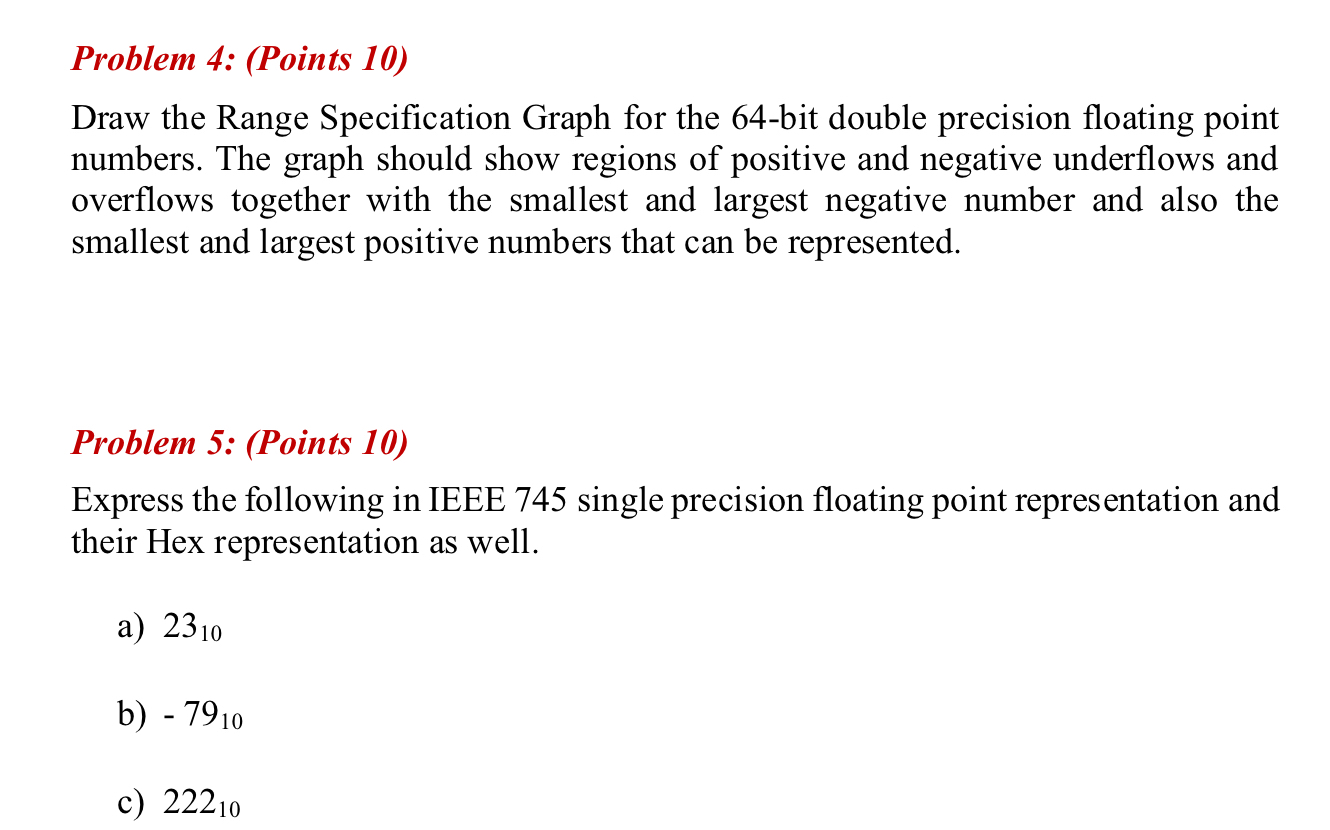
Draw the Range Specification Graph for the bit double precision floating point numbers. The graph should show regions of positive and negative underflows and overflows together with the smallest and largest negative number and also the smallest and largest positive numbers that can be represented.
Problem : Points
Express the following in IEEE single precision floating point representation and their Hex representation as well.
a
b
c
Step by Step Solution
There are 3 Steps involved in it
1 Expert Approved Answer
Step: 1 Unlock

Question Has Been Solved by an Expert!
Get step-by-step solutions from verified subject matter experts
Step: 2 Unlock
Step: 3 Unlock